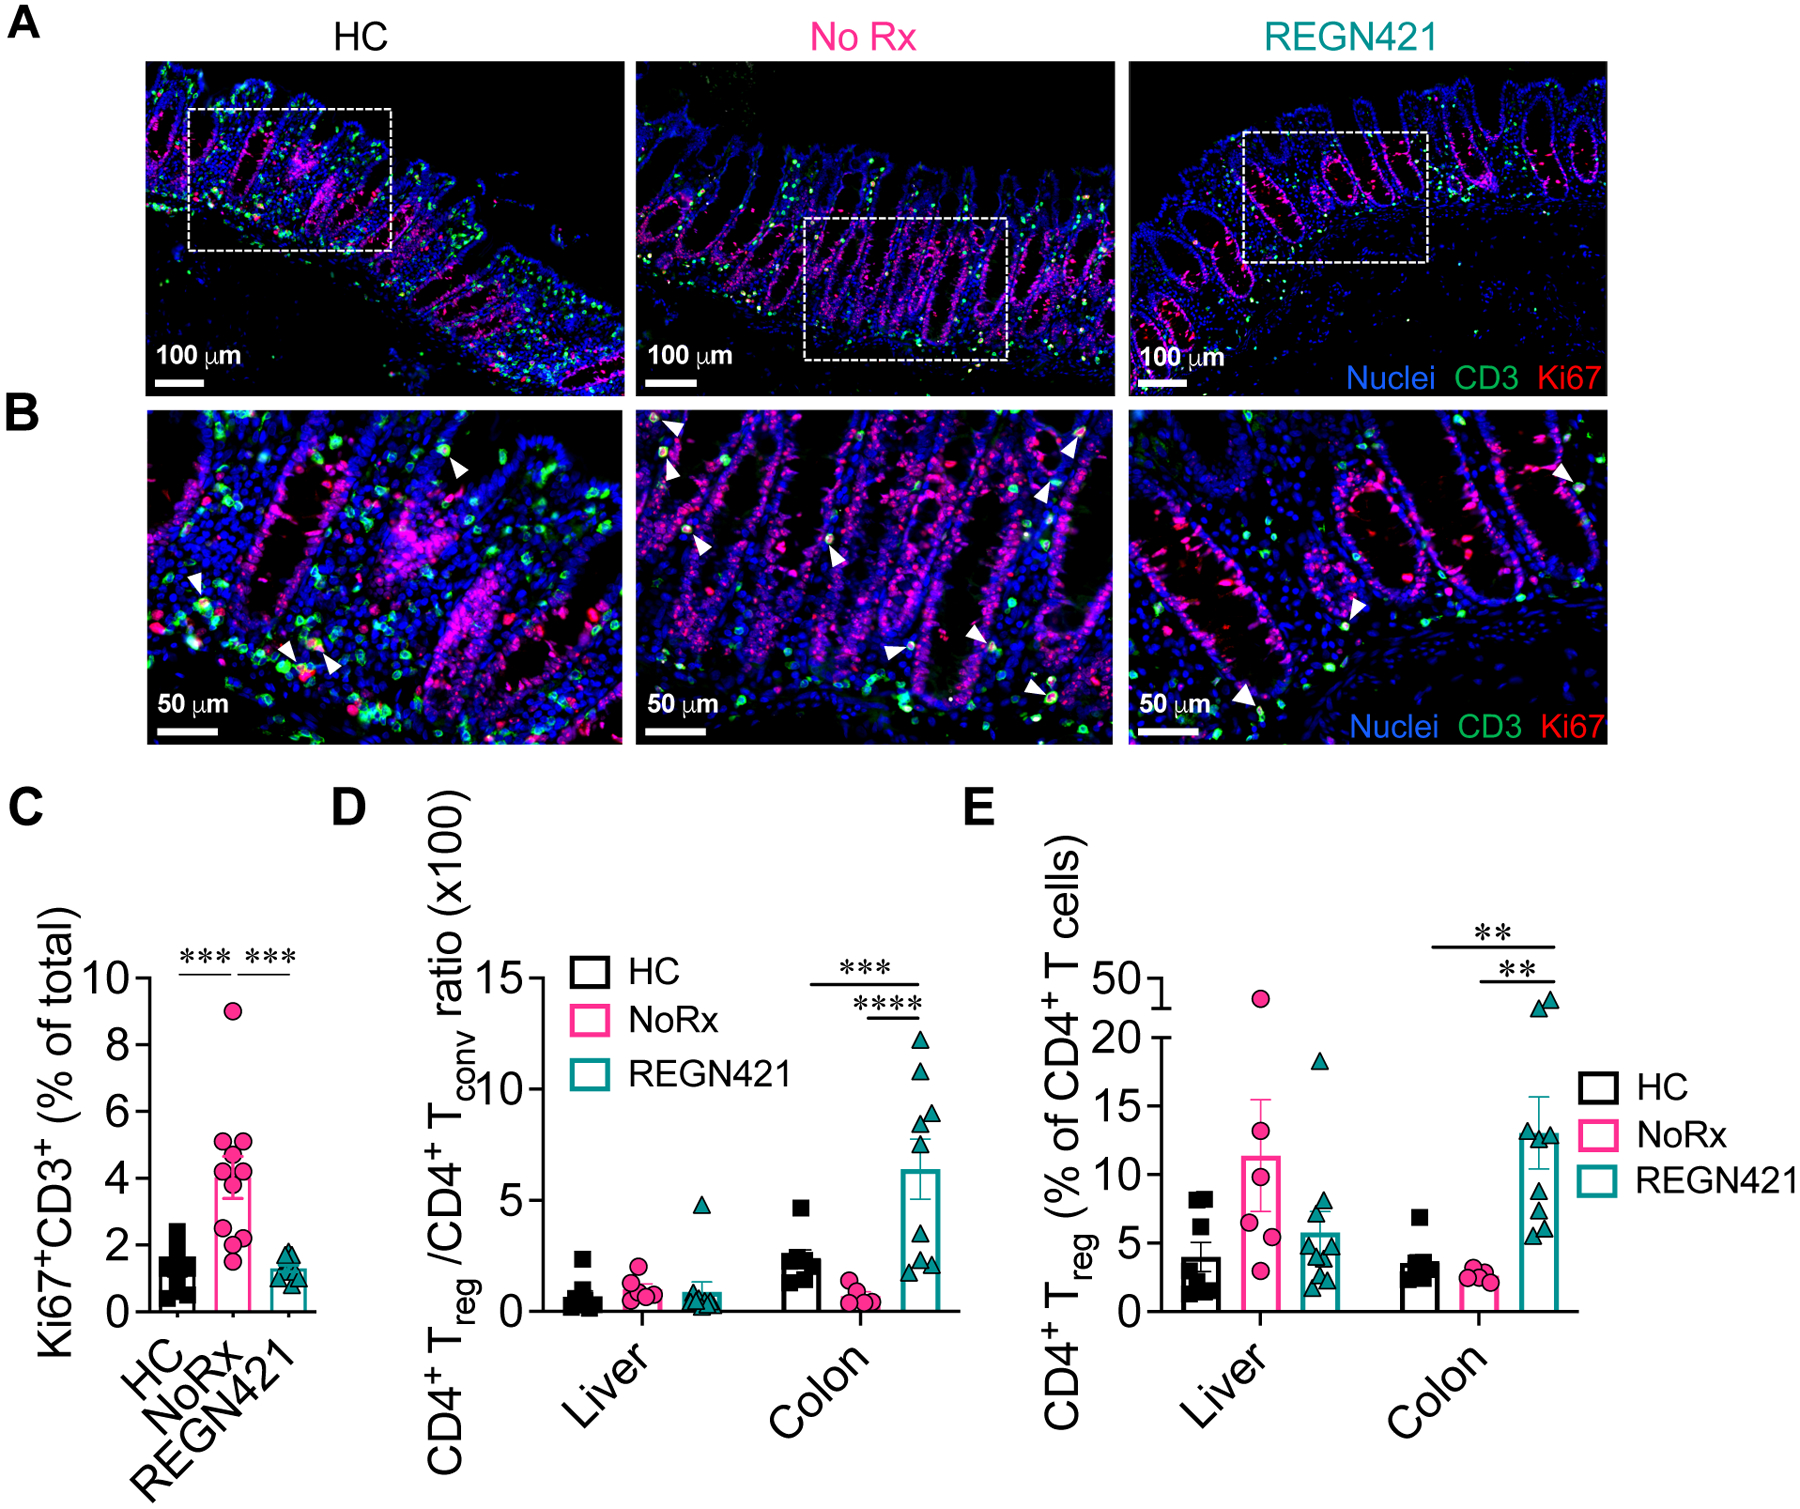
Figure 4. DLL4 blockade inhibits the accumulation of activated tissue-infiltrating T cells in the intestine during aGVHD.

(A to C) Immunofluorescence microcopy of paraffin-embedded colon collected at terminal analysis. Samples from healthy controls (HC) were compared to terminal analysis of allo-HCT recipients from untreated aGVHD (NoRx) or REGN421-treated experimental cohorts. (A) Representative staining for CD3 (green), Ki67 (red) and nuclei visualized by Hoechst (blue). (B) Cropped areas in (A) are enlarged with white arrowheads pointing to CD3+Ki67+ T cells. (C) Quantification of Ki67+CD3+ T cells among total nucleated cells (n=11 images from 5 animals per group). ***p<0.001, Kruskal-Wallis multiple comparison test. (D and E) Treg:Tconv ratio (D) and %Foxp3+ Treg cells (E) were quantified among CD4+ T cells in the liver and colon from healthy controls (n=8) versus at terminal analysis in allo-HCT recipients from untreated aGVHD (NoRx, n=7) or REGN421-treated (n=10) cohorts. **p<0.01, ***p<0.001, ****p<0.0001, one-way ANOVA with Tukey post-hoc test.
