
Fig. 2.
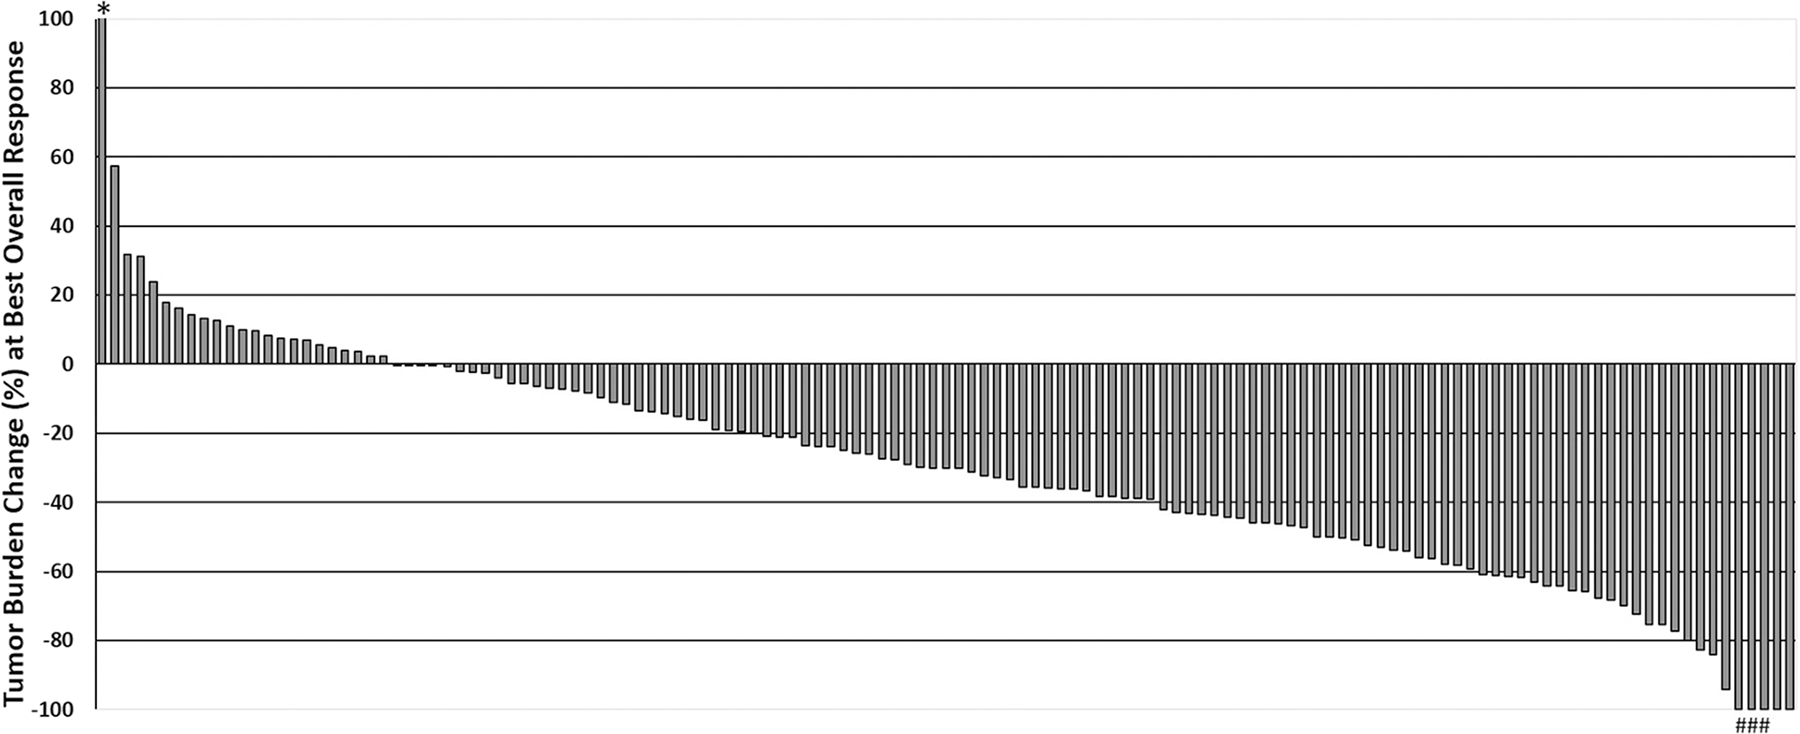
Waterfall plot of the tumor burden changes (%) at the best overall response (BOR). One patient (#) demonstrated an initial tumor increase meeting the criteria for PD (+ 23.8%) followed by tumor shrinkage of ≥ 30% decrease compared to the baseline (pseudoprogression). Among 5 patients who achieved a 100% decrease of the target lesions, two had CR as BOR, and three (*) had PR as their BOR because their non-target lesions did not disappear completely