
Figure 6.
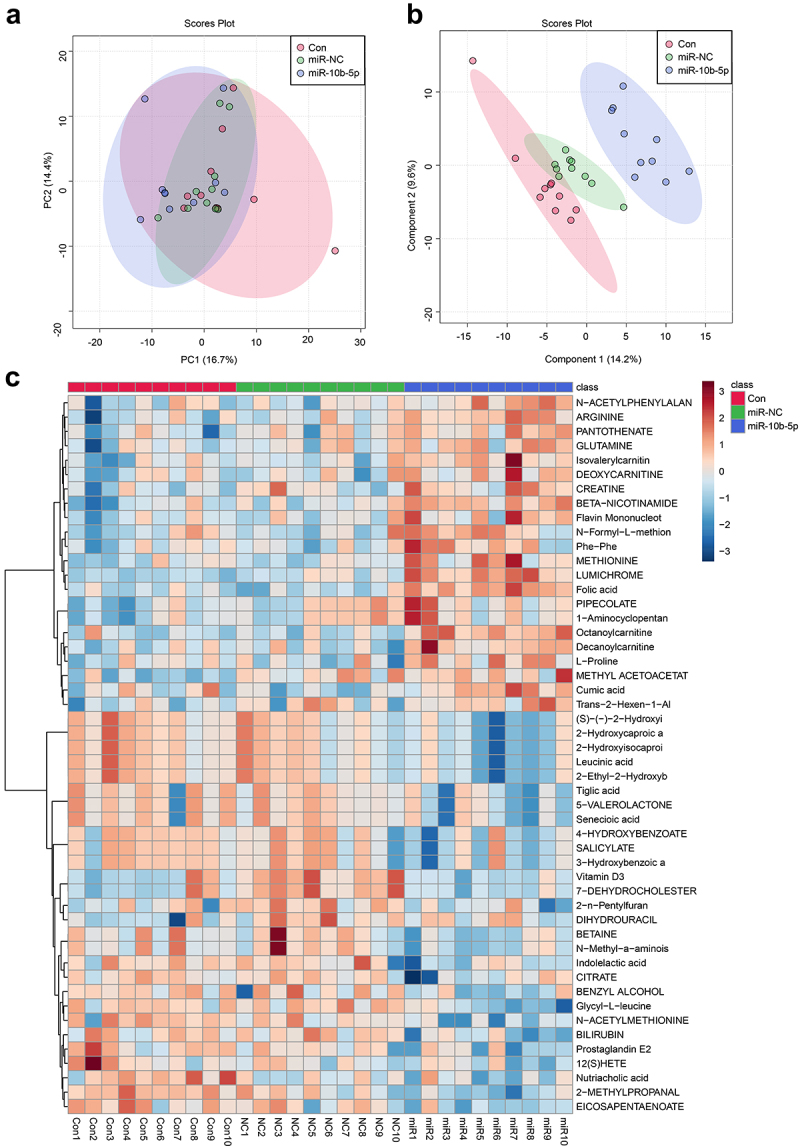
miR-10b-5p modulates the metabolic profiles of tumor tissues. (a) PCA scores plot for different groups. (b) PLS-DA scores plot for different groups. (c) The heat map of the metabolic features in the tumor tissues of different groups. (d) Boxplots of several key differential metabolites expression. *p < .05.