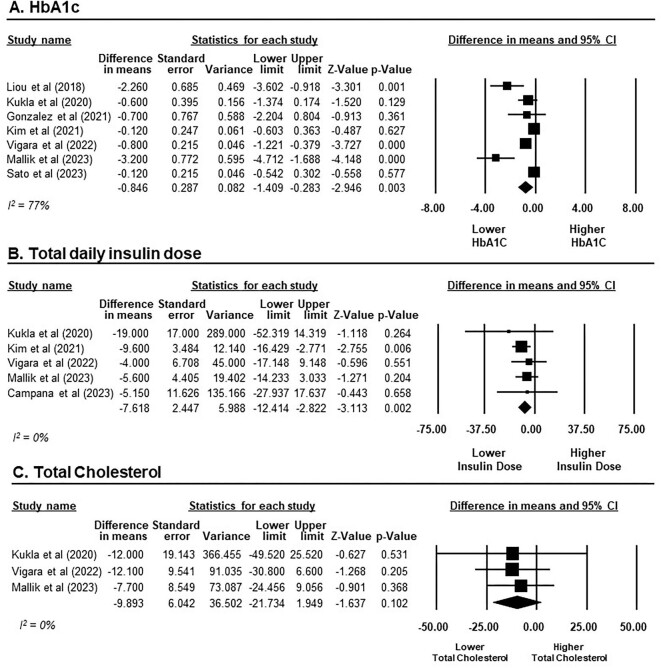
Figure 3:
Changes in glycaemic and metabolic outcomes from baseline after GLP-1RAs treatment in KTRs. (A) HbA1c presented on a scale ranging from −8 to 8%. (B) Total daily insulin dose presented on a scale ranging from −75 to 75 units. (C) Total cholesterol presented on a scale ranging from −50 to 50 mg/dl. Studies are identified by the name of the first author and the year of publication. MDs were determined using the random effects model.

