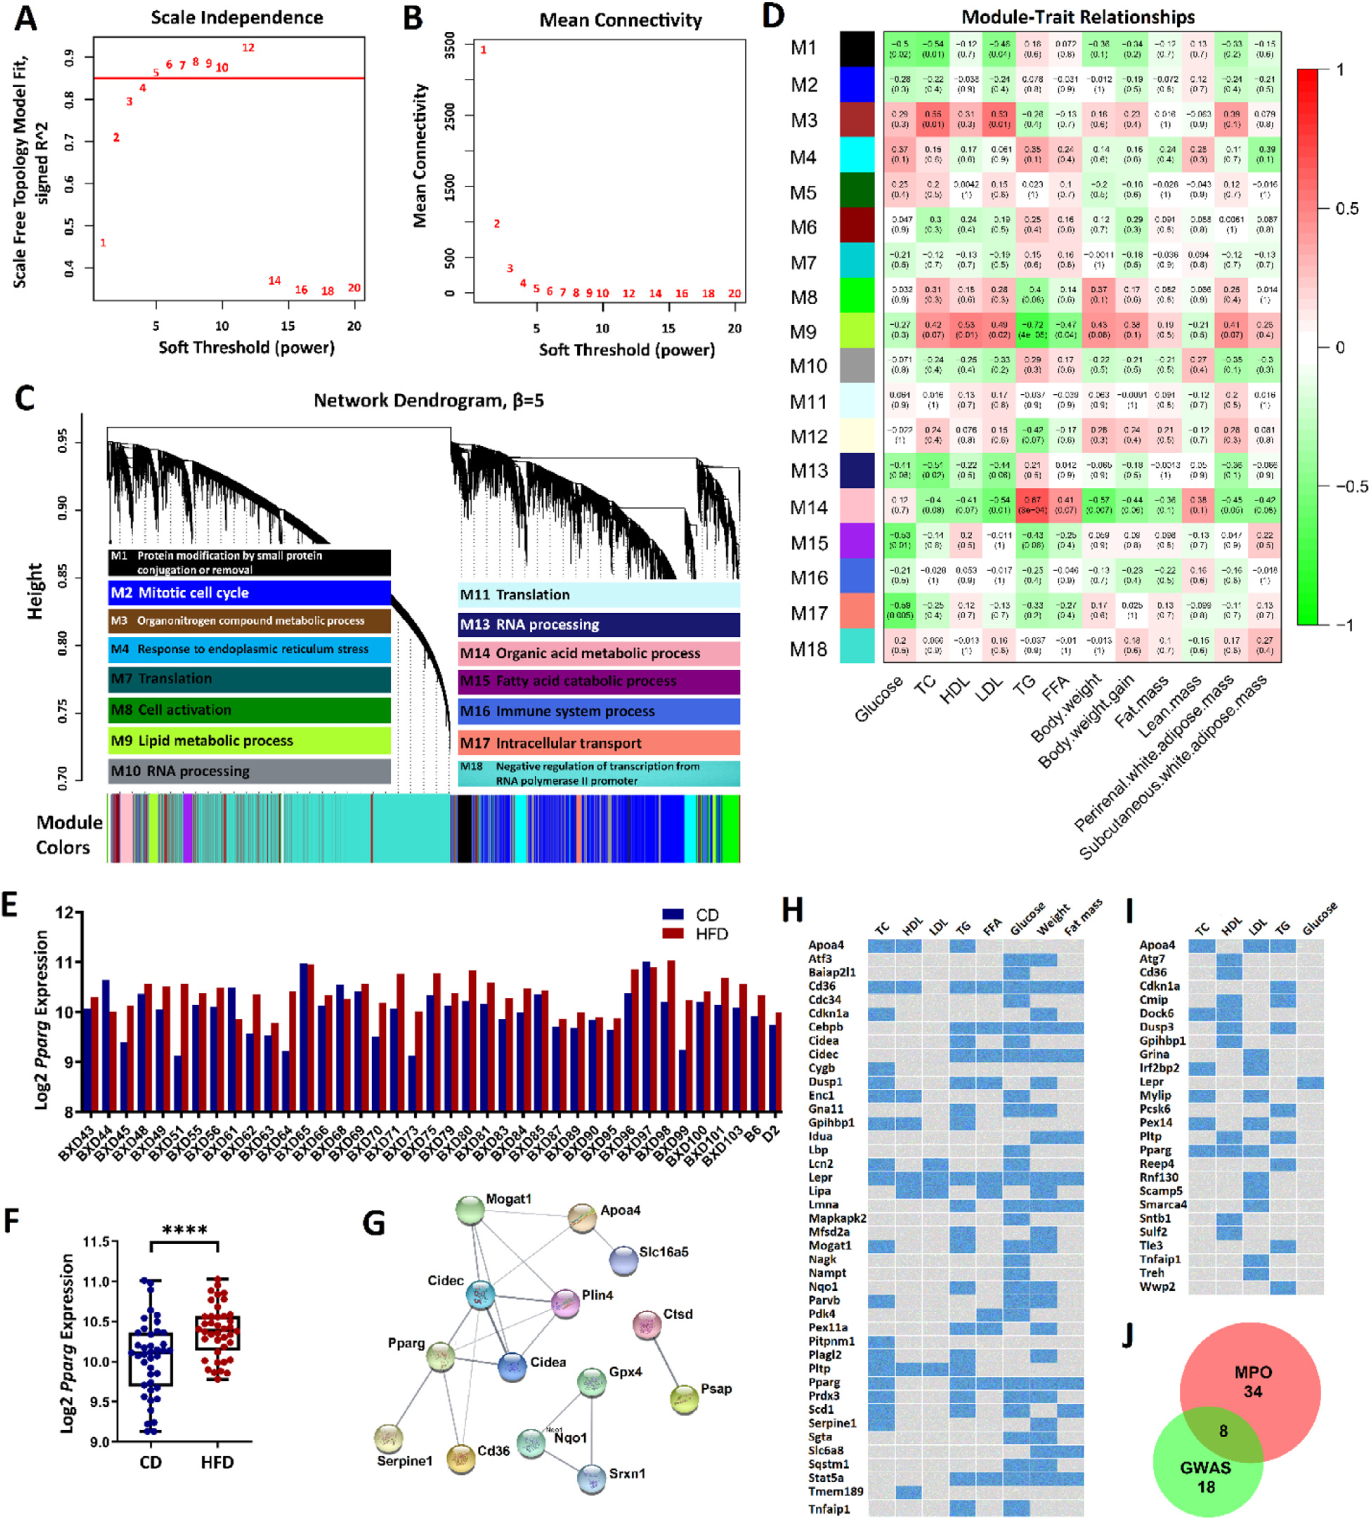
Fig. 2.

HFD module M9 is responsive to diet and associated with plasma lipids. (A) Soft thresholding index R2 as a function of soft-thresholding power indicated scale-free topology. (B) Mean connectivity (degree) as a function of . (C) 18 coexpression modules identified from HFD liver transcriptome data by dendrogram branch cutting and their most significantly enriched GO term among discrete biological processes. (D) Associations (Pearson correlation r, with FDR in parentheses) between HFD module eigengenes and plasma lipid phenotypes. (E) Pparg expression across BXD strains. (F) Mean difference in Pparg expression between diets. ****FDR < 0.0001. (G) Protein-protein interaction subnetworks from the top 30 hub genes in module M9. 14 genes have predicted interaction scores > 0.4 (medium confidence). (H-I) Module M9 gene-trait heatmap retrieved from the MPO (H) and human NHGRI GWAS Catalog (I). Blue cells represent genes with functional roles critical or associated with the corresponding trait(s). (J) Venn diagram of gene overlap between MPO and GWAS.
