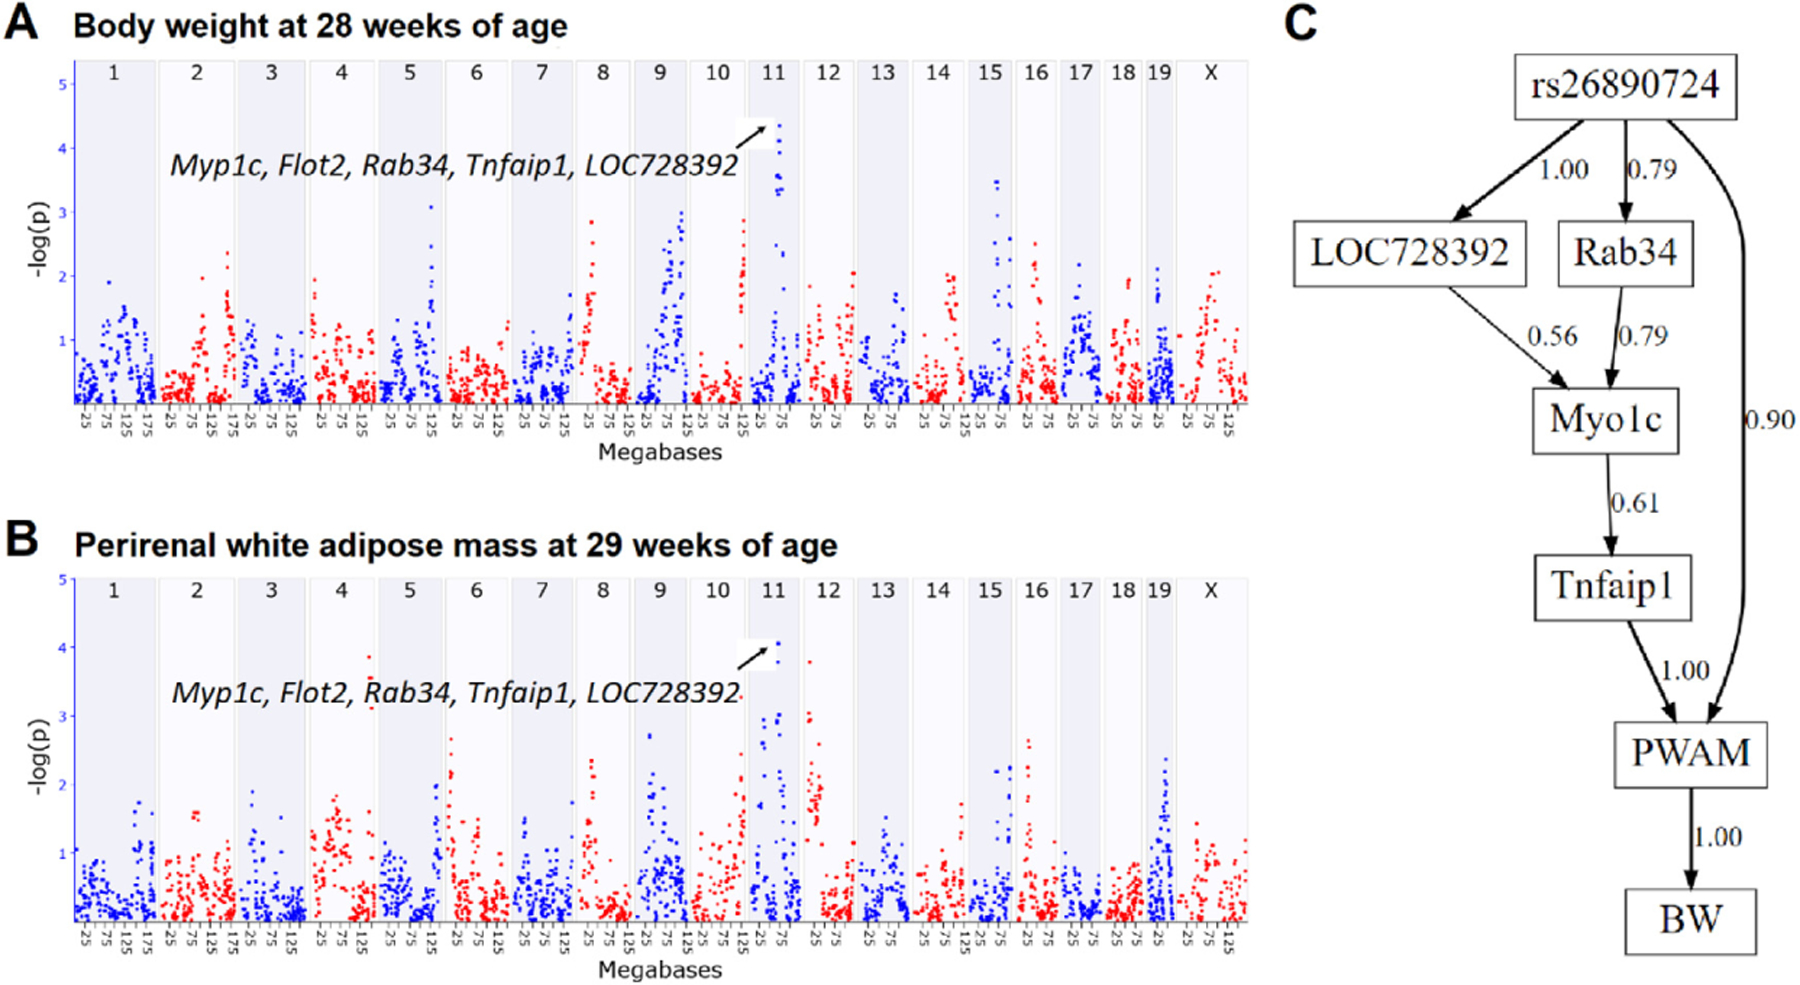
Fig. 3.

Causal analysis of M9 module genes (A-B) QTL mapping for body weight and perirenal white adipose mass on chromosome 11 (C) Bayesian network structure connecting QTL genotype (rs26890724), gene expression, and body weight (BW) and perirenal white adipose mass (PWAM) phenotypes. Numbers next to each network edges indicate edge confidence from model averaging of the 1,000 highest scoring networks.
