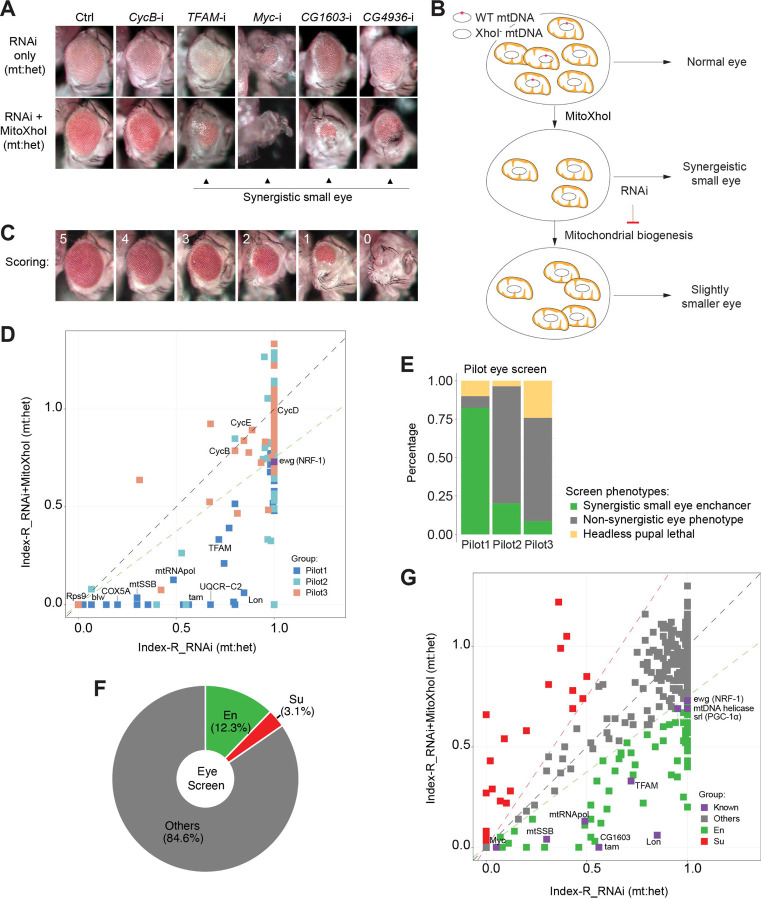
Figure 1. A genetic modifier screen identifying transcription factors regulating ETC biogenesis.
(A) Representative images of adult eye for the control RNAi (Ctrl) and RNAi of selected genes tested in the eye screen, including CycB RNAi (CycB-i), TFAM RNAi (TFAM-i), Myc RNAi (Myc-i), CG1603 RNAi (CG1603-i) and CG4936 RNAi (CG4936-i). The upper panel shows eyes from RNAi-only offspring and lower panel displays eyes from RNAi+MitoXhoI offspring cultured at the same condition. Arrowheads indicate the synergistic small eye phenotype resulting from the combination of gene knockdown and the mtDNA deficiency caused by mitoXhoI in the background of heteroplasmic mtDNAs. (B) Schematic of the genetic modifier screen methodology (see text for details). (C) Representative images illustrating the scoring of eye size. (D) A plot illustrating the calling of positive hits in the pilot screen. Each datapoint represents the Index-R of RNAi (X values) or RNAi+MitoXhoI flies (Y values) for each gene belonging to the different groups (see Figure 1E and Supplementary file 1 for details). Genes with datapoints lie below the grey diagonal dash line exhibited a synergistic effect when combining their RNAi with mtDNA deficiency suggesting a potential role in regulating ETC biogenesis. The datapoint for ewg, the fly homolog of NRF-1, is labeled in purple. The green dashed line of slope 0.75 outlines the threshold for calling out positive hits based on ewg’s performance in the screen. (E) Graph summarizing the pilot screen of nuclear-encoded genes, demonstrating the efficacy of this screen in identifying genes involved in mitochondrial ETC biogenesis. Pilot group 1 (Pilot1) has 40 genes that are either nuclear-encoded ETC subunits or related to mtDNA maintenance and gene expression (Mito-EBR). Pilot2 has 84 genes involved in other mitochondrial processes. Pilot3 has 58 essential genes from other cellular components. (F) Graph summarizing the percentages of synergistic enhancers (En) and suppressors (Su) identified in the screen (see Figure 1G and Supplementary file 1 for details). (G) A plot illustrating the calling of positive hits in the screen of TF genes. Factors that are known to be involved in mitochondrial or ETC biogenesis are marked in purple (Known). The green dashed line outlines the threshold for calling out synergistic enhancers (En, green square). The red dashed line of slope 1.5 outlines the threshold for calling out suppressors (Su, red square).

