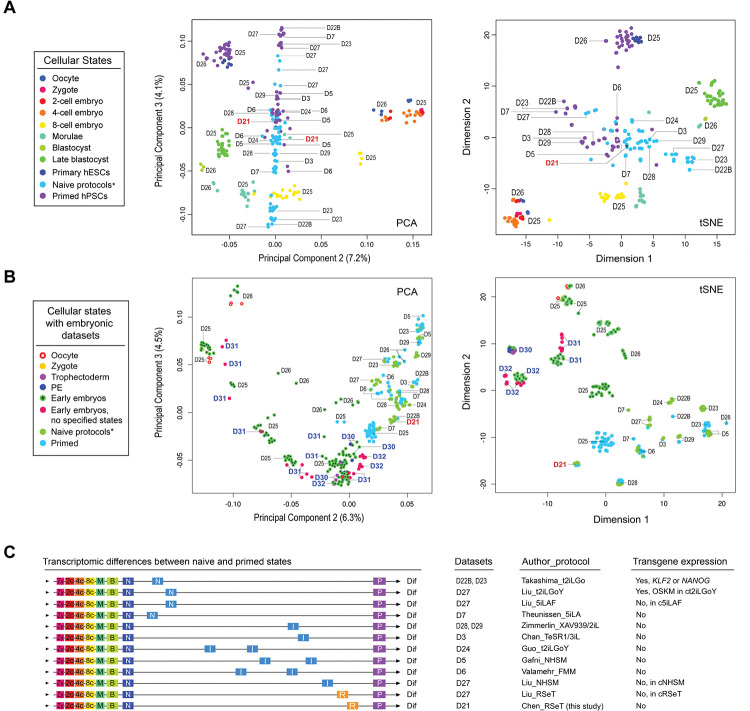
Figure 3. Genome-wide transcriptomic analysis of RSeT hESCs and meta-analysis of human naïve pluripotency.
(A) Comparative meta-analysis of hPSC datasets generated from various protocols by Pearson correlation-based PCA and t-distributed stochastic neighbor embedding (t-SNE), which depict cellular and pluripotent states (color-coded dots) with dataset identification numbers as labeled (D3 to D29). The datasets used for comparison in this study were designated based on the name of first authors of published reports as detailed previously (Johnson et al., 2021). (B) PCA and t-SNE of detailed pluripotent states and developmental stages with the addition of multiple early primate embryo datasets (D30 to D32). (C) Mapping cellular and pluripotent states based on the Euclidean distance of gene-wide transcriptomic datasets. Abbreviations for cellular states and human naïve protocols (including the expression of transgenes) are indicated, which are also detailed in Materials and Methods and in the legend to Figure 1A. Additional abbreviations: Dif, lineage differentiation; I, intermediate transitions between the naïve and primed states; N, cells with naive pluripotent states; OKSM, transgene expression of the Yamanaka factors OCT4, KLF4, SOX2, and c-MYC; P, primed pluripotent states; R, hPSCs with a distinct pluripotent state in RSeT medium.

