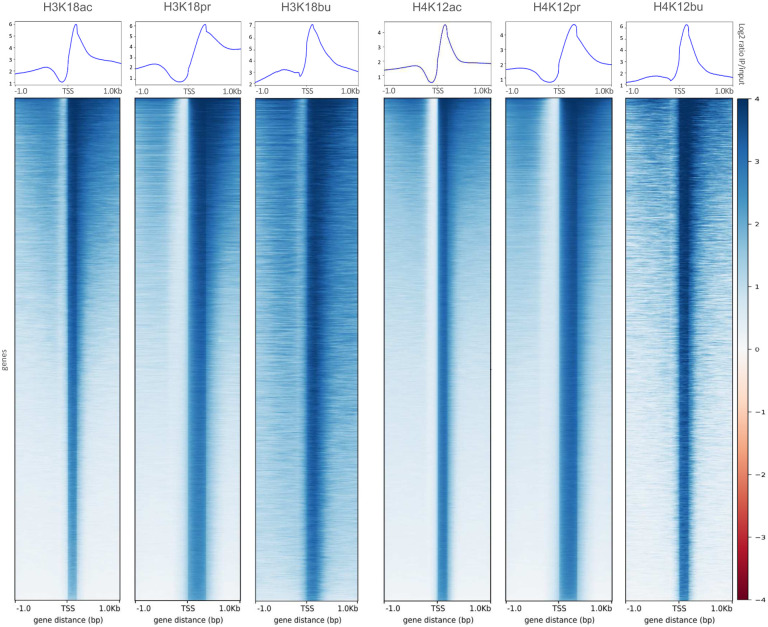
Fig. 3 |.
TSS distribution profiles of H3K18ac/pr/bu and H4K12ac/pr/bu associated ChIP-seq peaks as function of read coverage. Upper panels: Aggregate read density profile plots of genomic region distributions within +/− 1 Kb of TSS as a function of log2 IP/input ratio. Lower panels: Read density heatmaps of gene distributions with maximum (z = 4) and minimum (z = - 4) values of heatmap intensities. Plots generated by deepTools.

