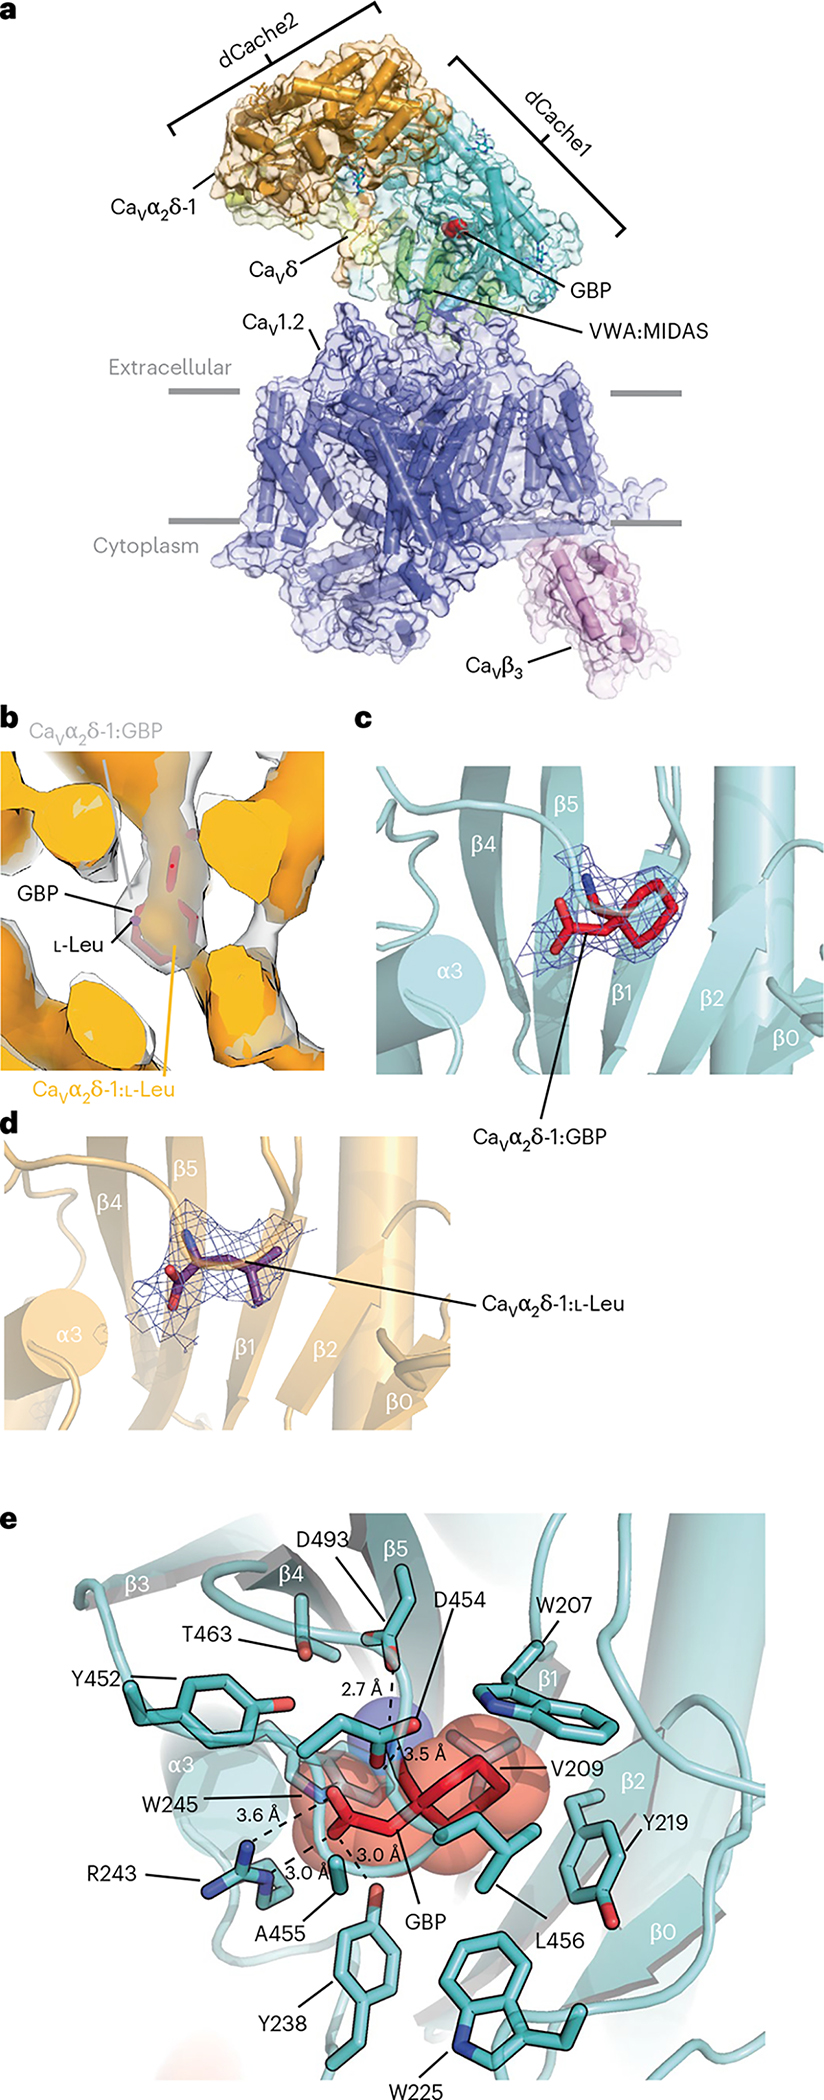
Fig. 1 |. Structure of the CaV1.2(ΔC)/CaVβ3/Cavα2δ-1:GBP complex.

a, Side view of the CaV1.2(ΔC)/CaVβ3/CaVα2δ-1:GBP complex. Subunits are colored with CaV1.2(ΔC) in slate and CaVβ3 in violet. CaVα2δ domains are colored with dCache1 in aquamarine, dCache2 in orange, VWA:MIDAS in green and CaVδ in yellow. GBP (in red) is shown as space filling. Gray bars denote the membrane. b, Comparison of CaVα2δ-1 dCache1 binding sites. Map comparison of the dCache1 ligand-binding site for the GBP complex (clear) and the l-Leu complex13 (orange). GBP is shown as red sticks. Map label colors match the respective map colors. c,d, Ligand densities for GBP (10σ, red, c) and l-Leu (7σ, violet purple, d) in the dCache1 domains are shown as cartoons (aquamarine and light orange, respectively). e, CaVα2δ-1 dCache1 ligand-binding site details. GBP (red) and contacting CaVα2δ-1 side chains (green-cyan) are shown as sticks. Distances for the dashed-line interactions are indicated.
