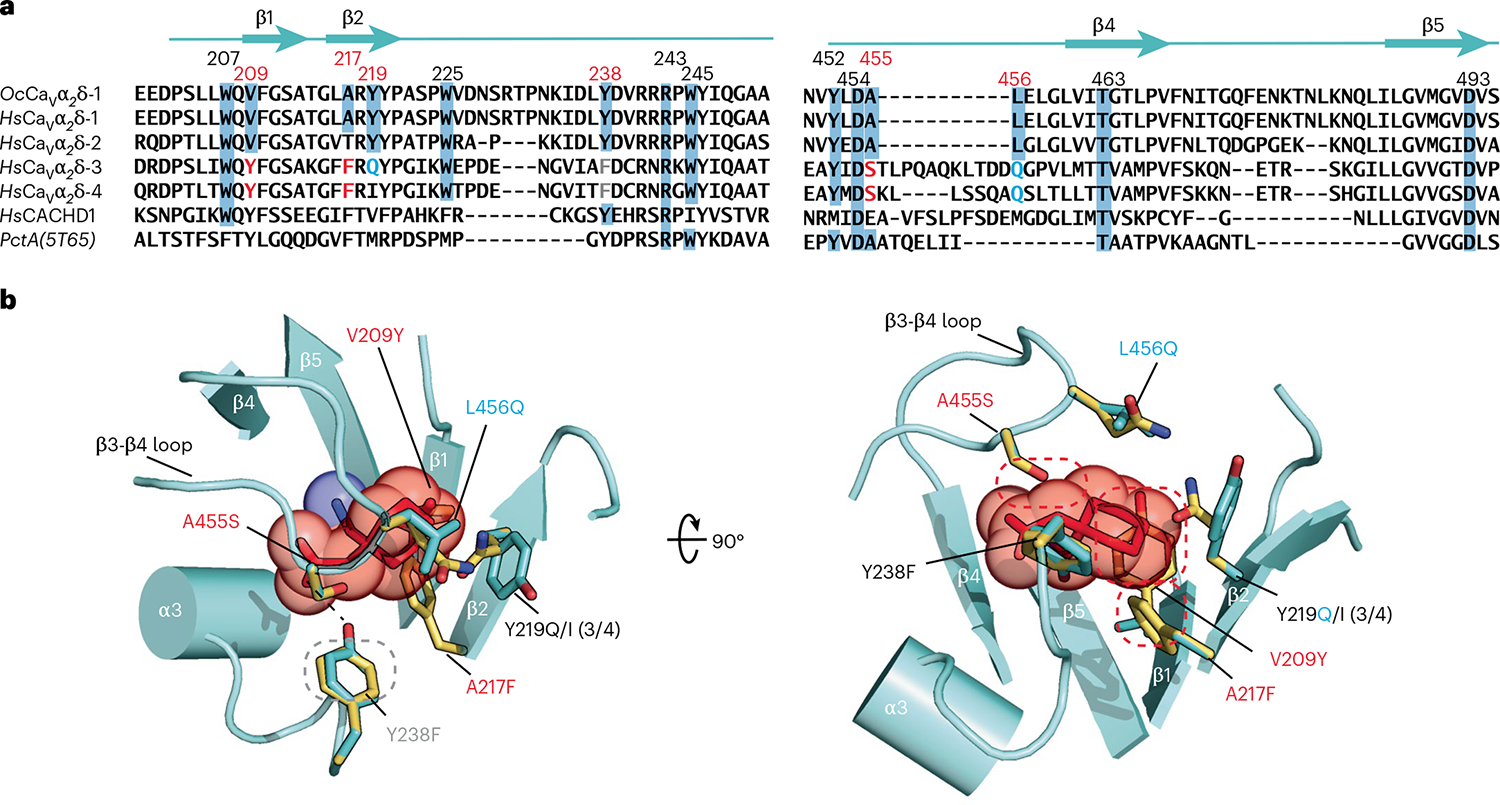
Fig. 2 |. Comparison of CaVα2δ-1 GBP-binding sites.

a, Sequence comparison of rabbit OcCaVα2δ-1 (NCBI, NP_001075745.1), human HsCaVα2δ-1 (NCBI, NP_001353796.1), HsCaVα2δ-2 (NCBI, NP_006021.2), HsCaVα2δ-3 (NCBI, NP_060868.2), HsCaVα2δ-4 (NCBI, NP_758952.4) and HsCACHD1 (NCBI, NP_065976.3), and bacterial PctA (PDB 5T65)34 dCache1 domain sequences. Numbers indicate residues interacting with l-Leu and GBP. Red numbers indicate sites that differ between GBP-sensitive and GBP-insensitive isoforms. Residue colors indicate steric clash (red), hydrogen bond loss (gray), and polarity changes (blue) between GBP-sensitive and GBP-insensitive isoforms. b, Structural context for amino acid differences between GBP-sensitive (aquamarine) and GBP-insensitive (yellow) CaVα2δ-1 Cache1 ligand-binding sites. GBP-insensitive residues are modeled on the CaVα2δ-1:GBP structure. Dashed ovals denote hydrogen bond loss (gray) and steric clashes (red). (3/4) indicates amino acid changes for CaVα2δ-3 and CaVα2δ-4.
