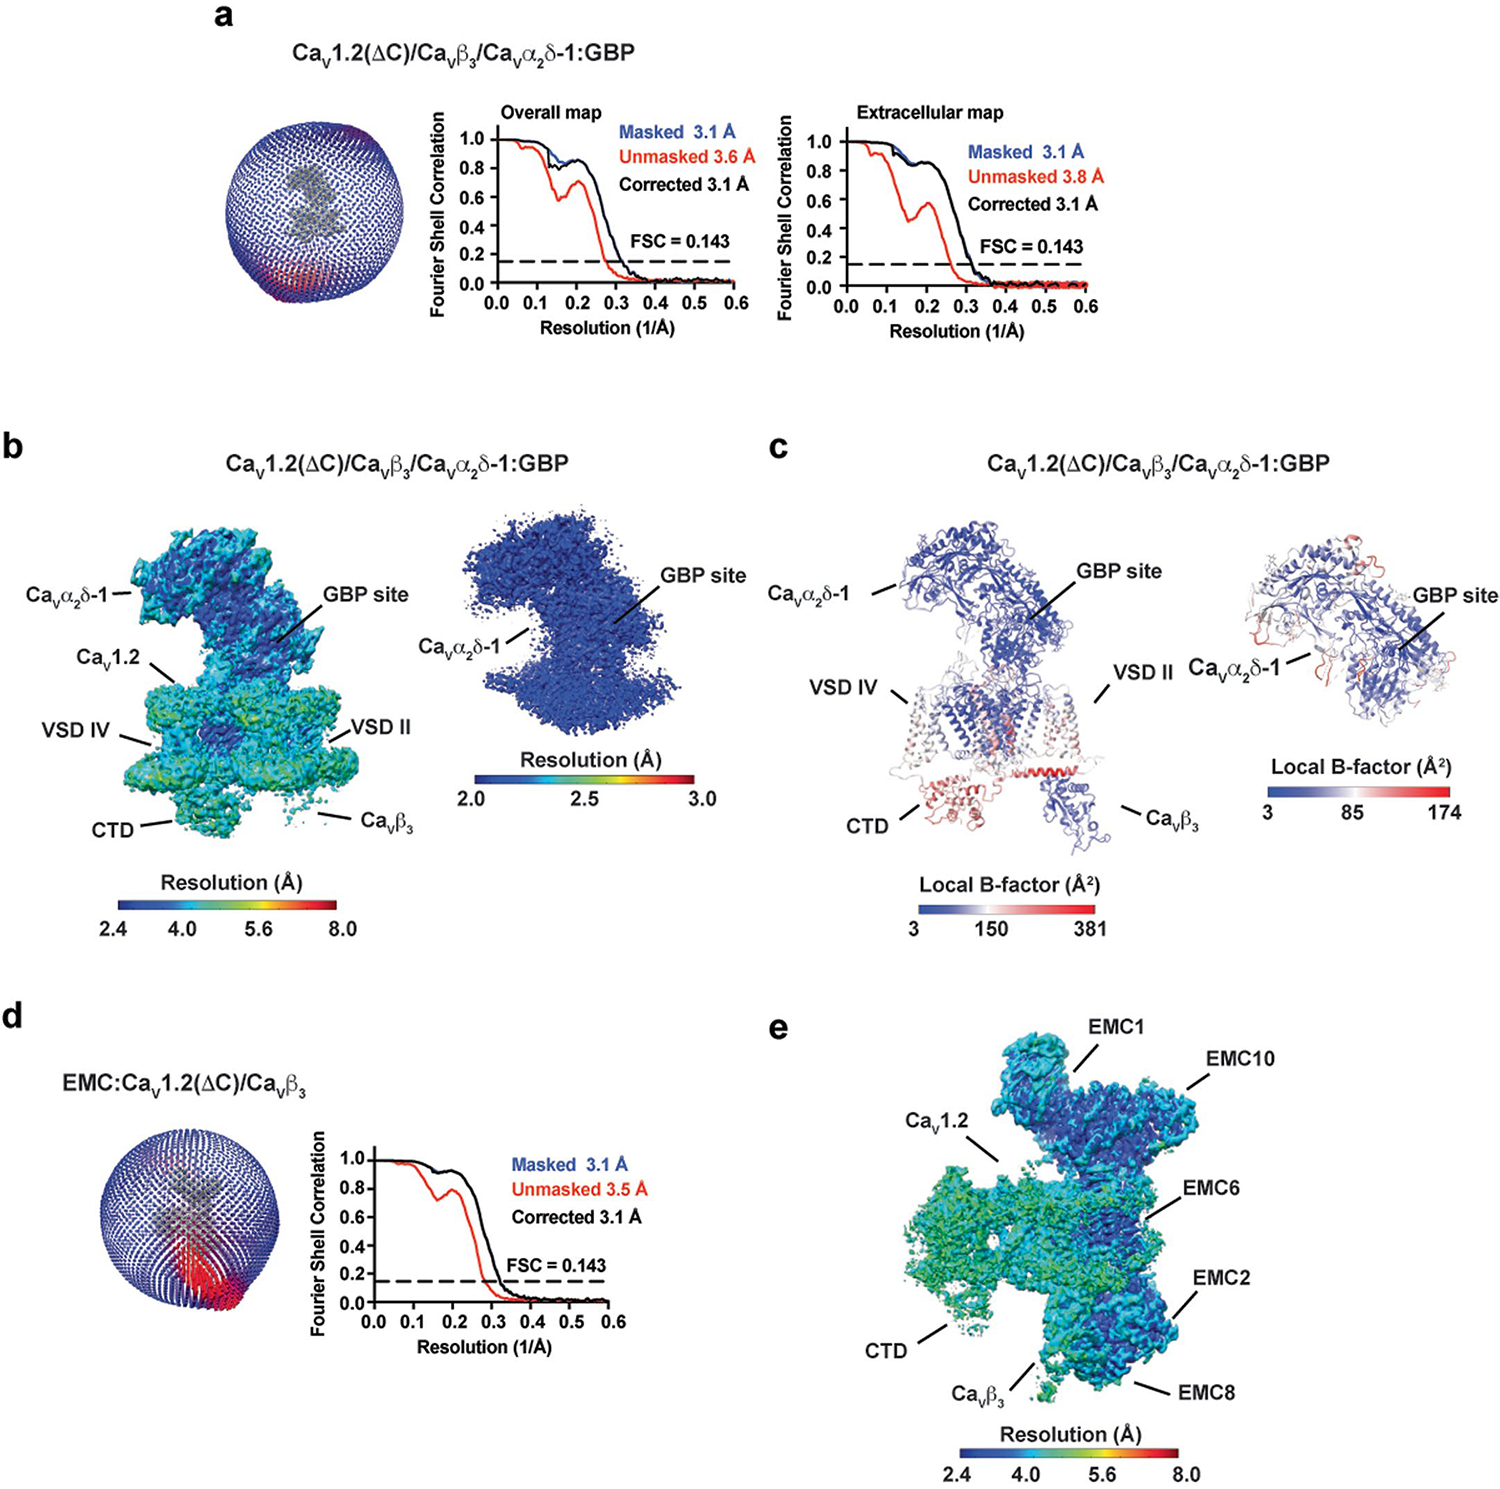
Extended Data Fig. 2 |. CaV1.2(ΔC)/CaV β3/CaVα2δ-1:GBP map and model quality.

a, Particle distribution plot and gold-standard Fourier shell correlation (FSC) curve for the overall CaV1.2(ΔC)/CaV β3/CaVα2δ-1:GBP complex map and the extracellular map containing CaVα2δ-1:GBP. b, local resolution for the overall CaV1.2(ΔC)/CaV β3/CaVα2δ-1:GBP map and the extracellular map containing CaVα2δ-1:GBP. c, local B-factor for the overall CaV1.2(ΔC)/CaV β3/CaVα2δ-1:GBP model and the CaVα2δ-1:GBP subunit. d, Particle distribution plot and gold-standard Fourier shell correlation (FSC) curve for the EMC:CaV1.2(ΔC)/CaVβ3 complex from the CaV1.2(ΔC)/CaV β3/CaVα2δ-1:GBP sample. e, EMC:CaV1.2(ΔC)/CaVβ3 complex local resolution. Select elements of each complex are labeled.
