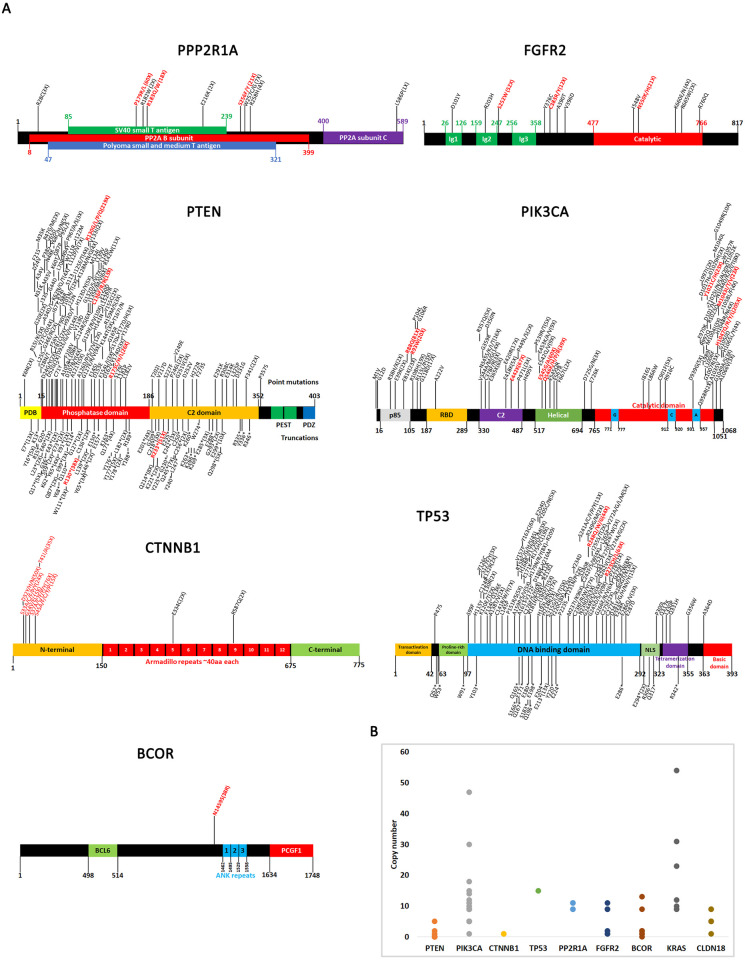
Fig 3. Driver mutations and copy number variations of most significantly altered genes.
A. Domain diagrams of genes with location of driver mutations shown. Only driver mutations identified from CHASM are mapped onto these diagrams and the high frequency ones are indicated in red. The number of incidences of a certain mutation is shown in parentheses. All gene maps were made based on previous reports: PPP2R1A [58, 85–88], FGFR2 [73, 89], PTEN [90–94], PIK3CA [95, 96], CTNNB1 [68, 70, 97, 98], TP53 [99, 100], and BCOR [101]. B. Copy number variations of most significantly altered genes. Each dot represents one sample where high copy number was detected.

