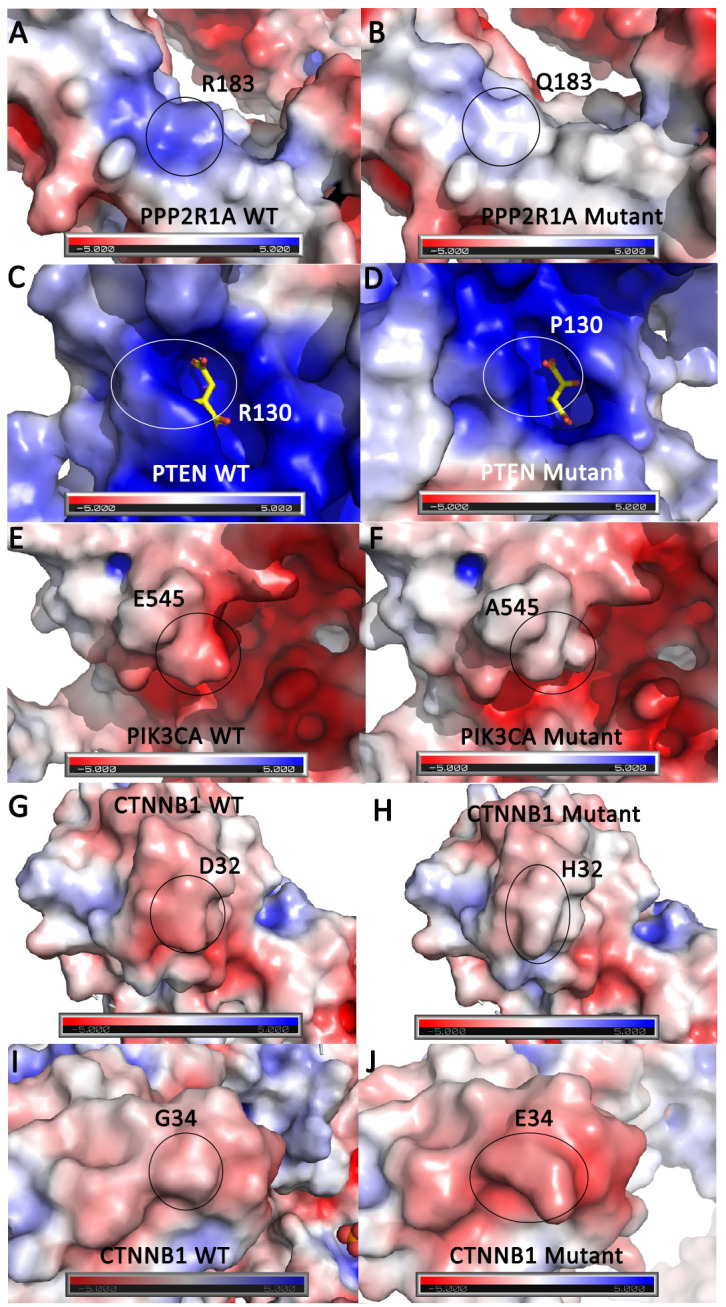
Fig 4. Top five driver mutations that alter protein electrostatic surface potential.

Surface rendering of the protein structure is shown with basic or positive surface potential colored blue, acidic or negative colored red, and neutral colored white. The WT or mutant residue location is identified by a black or white circle. A. PPP2R1A WT R183 residue compared to B. PPP2R1A mutant Q183 residue. C. PTEN WT R130 residue with a tartrate molecule shown in yellow sticks compared to D. PTEN mutant P130 residue. E. PIK3CA WT E545 residue compared to F. PIK3CA mutant A545 residue. G. CTNNB1 WT D32 residue compared to H. CTNNB1 mutant H32 residue. I. CTNNB1 WT G34 residue compared to J. CTNNB1 mutant E34 residue.
