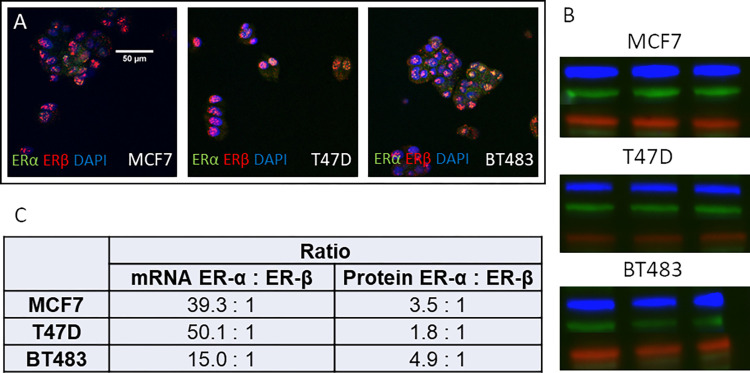
Fig 1. Cellular localization of ERα:ERβ and quantification of ERα:ERβ mRNA and protein expression in MCF7, T47D & BT483 cells.
(A) Immunocytochemistry: ERα = green, ERβ = red, DAPI = blue, co-localisation = yellow (B) Western blots: ERα = blue, ERβ = green, GAPDH = red. Full western blot image available in S1 Fig. (C) Quantification of mRNA transcripts by qRT-PCR (n = 3 per cell line) and protein expression by quantification of Western blot band density (n = 3 per cell line).

