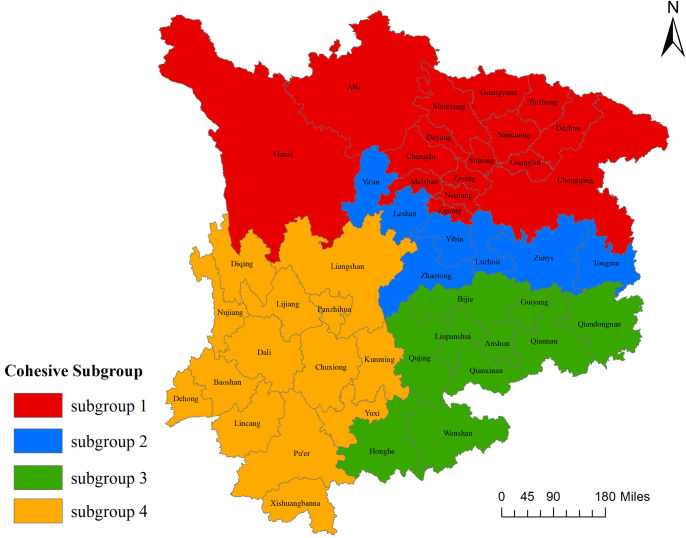
Fig 4. Evolution of the spatial correlation network of cultivated land utilization ecological efficiency in the upper reaches of the Yangtze River from 2010 to 2020.
The map was prepared with ArcGIS10.1 (https://resources.arcgis.com/en/help/). The administrative boundary was republished from[34] under a CC BY license, with permission from Resource and Environment Science and Data Center (https://www.resdc.cn/), original copyright 2023.

