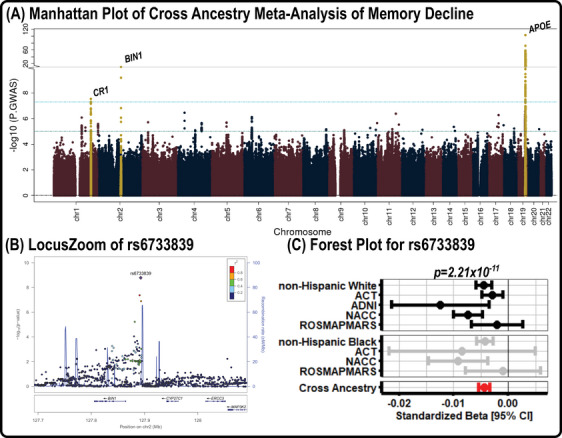
FIGURE 2.

Memory decline GWAS results. (A) Manhattan plot of the results from the GWAS on memory decline, in which genome‐wide significance (5.0 × 10⁻⁸) and suggestive significance (1.0 × 10⁻⁵) are marked by cyan and teal lines, respectively. (B) LocusZoom plot for the top locus (rs6733839) outside of the APOE region, in which colors highlight the locus disequilibrium. (C) A forest plot for rs6733839, which shows the direction and magnitude of effect for all NHW and NHB datasets. The summary estimate for the NHW, NHB, and cross‐ancestry meta‐analyses are also presented. ACT, Adult Changes in Thought; ADNI, Alzheimer's Disease Neuroimaging Initiative; APOE, apolipoprotein E; CI, confidence interval; GWAS, genome‐wide association studies; NACC, National Alzheimer's Coordinating Center; NHB, non‐Hispanic Black; NHW, non‐Hispanic White; ROSMAPMARS, Religious Orders Study /Memory and Aging Project /Minority Aging Research Study.
