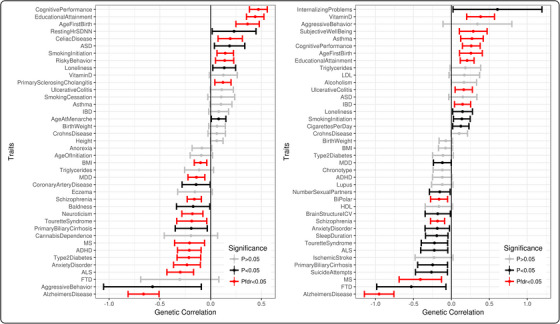
FIGURE 3.

Genome‐wide genetic correlation results. Genetic correlation between memory performance (A) and memory decline (B) with 65 complex traits. Error bars represent 95% confident intervals. ADHD, attention deficit hyperactivity disorder; ALS, amyotrophic lateral sclerosis; ASD, autism spectrum disorders; BMI, body mass index; FTD, frontotemporal dementia; HLD, high‐density lipoprotein; IBD, inflammatory bowel disease; ICV, intracranial volume; LDL, low‐density lipoprotein; MDD, major depressive disorder; MS, multiple sclerosis; SDNN, standard deviation of the NN interval (ie, interval between two heart beats).
