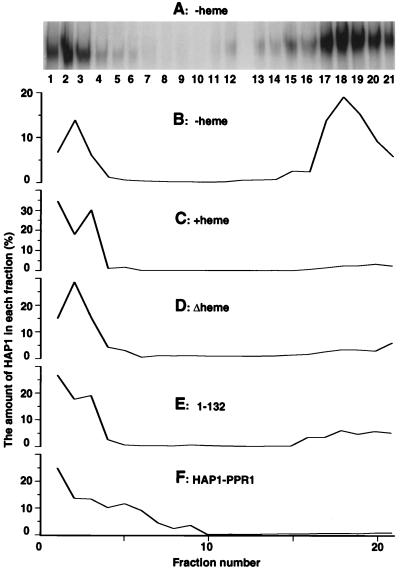
FIG. 1.
Analysis of HAP1 complexes by sucrose gradient centrifugation. (A) Analysis of HAP1 complexes in fractions from a 10 to 45% sucrose gradient in the absence of heme. The fraction numbers were counted from top to bottom (i.e., fraction 1 corresponds to 10% sucrose, while fraction 21 corresponds to 45% sucrose). The amounts of HAP1 in fractions were detected in the presence of heme by DNA mobility shift assays. The low level of dimeric complexes in fractions 1 to 3 is due to HAP1 overexpression or disruption of the HMC (47). (B) Distribution profile of HAP1 in the sucrose gradient in the absence of heme. The fractions are the same as those shown in panel A, but HAP1 amounts were calculated and plotted as percentages of the total HAP1 amount in all fractions. (C) Distribution profile of HAP1 in the sucrose gradient in the presence of heme. (D) Distribution profile of HAP1Δheme in the sucrose gradient. (E) Distribution profile of HAP1-132 in the sucrose gradient. (F) Distribution profile of HAP1-PPR1 in the sucrose gradient. No heme was included in the extracts loaded onto gradients shown in panels D to F. Note that different scales, especially in panels B and C, are used in the graphs in order to make them identical in size. The same HAP1 distribution profiles were obtained when Western blotting instead of DNA mobility shift assay was used to quantify HAP1 amounts. All extracts used here were prepared from JEL1 cells under previously established conditions (11, 47).

