
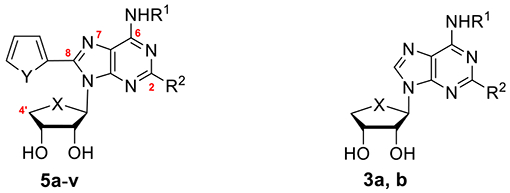
Table 1.
Binding Affinities of Compounds 5a–v at Four Subtypes of the hARs
|
||||||||
|---|---|---|---|---|---|---|---|---|
|
| ||||||||
| compd no. |
X |
Y |
R1 |
R2 |
Ki value (nM ± SEMa or % displacement at 10 μMb) |
|||
| hA1AR | hA2AAR | hA2BAR | hA3AR | |||||
|
| ||||||||
| 5a | O | O | H | 1-hexyne | 183 ± 28 | 18.0 ± 5.5 | 327 ± 32 | 15.5 ± 2.9 |
| 5b | O | O | CH3 | 1-hexyne | 3030 ± 50 | 50.5 ± 12.1 | 76 ± 1% | 2.9 ± 0.7 |
| 5c | O | O | 3-I-Bn | 1-hexyne | 13 ± 1% | 579 ± 53 | 4 ± 2% | 199 ± 20 |
| 5d = 4 | O | S | H | 1-hexyne | 392 ± 99 | 7.7 ± 0.5 | 834 ± 11 | 15.6 ± 1.6 |
| 5e | O | S | CH3 | 1-hexyne | 2310 ± 600 | 126 ± 18 | 52 ± 1% | 2.9 ± 0.5 |
| 5f | O | S | 3-I-Bn | 1-hexyne | 2580 ± 460 | 513 ± 153 | 2 ± 3% | 8.9 ± 4.8 |
| 5g | S | O | H | 1-hexyne | 46 ± 1% | 13.2 ± 0.2 | 1973 ± 251 | 119 ± 39 |
| 5h | S | O | CH3 | 1-hexyne | 17 ± 9% | 159 ± 17 | 41 ± 2% | 53.5 ± 16.9 |
| 5i | S | O | 3-I-Bn | 1-hexyne | 11 ± 7% | 5 ± 5% | 3 ± 2% | 2 ± 8% |
| 5j | S | S | H | 1-hexyne | 494 ± 122 | 61.4 ± 4.1 | 27 ± 2% | 150 ± 6 |
| 5k | S | S | CH3 | 1-hexyne | 11 ± 3% | 2820 ± 1080 | 11 ± 2% | 206 ± 26 |
| 5l | S | S | 3-I-Bn | 1-hexyne | 1 ± 0.2% | 2 ± 2% | 3 ± 3% | 12 ± 5% |
| 5m | S | O | H | Cl | 3890 ± 650 | 140 ± 10 | 53 ± 3% | 855 ± 157 |
| 5n | S | O | CH3 | Cl | 49 ± 1% | 752 ± 67 | 46 ± 1% | 94.6 ± 45.2 |
| 5o | S | O | 3-I-Bn | Cl | 4900 ± 1070 | 336 ± 108 | 51 ± 1% | 89.7 ± 20.4 |
| 5p | S | S | H | Cl | 1980 ± 140 | 459 ± 46 | 62 ± 3% | 294 ± 80 |
| 5q | S | S | CH3 | Cl | 26 ± 4% | 955 ± 704 | 17 ± 1% | 138 ± 10 |
| 5r | S | S | 3-I-Bn | Cl | 50 ± 2% | 720 ± 9 | 17 ± 2% | 137 ± 28 |
| 5s | S | O | H | tyramine | 46 ± 3% | 112 ± 6 | 227 ± 41 | 1650 ± 100 |
| 5t | S | O | CH3 | tyramine | 5330 ± 340 | 468 ± 28 | 713 ± 88 | 445 ± 148 |
| 5u | S | S | H | tyramine | 8050 ± 910 | 946 ± 94 | 608 ± 81 | 3010 ± 1140 |
| 5v | S | S | CH3 | tyramine | 47 ± 2% | 917 ± 59 | 579 ± 135 | 106 ± 27 |
| 3ac | S | H | 1-hexyne | 39 ± 10% | 7.19 ± 0.6 | N.D.d | 11.8 ± 1.3 | |
| 3bc | O | H | 1-hexyne | 740 ± 430 | 63.2 ± 15 | N.D.d | 138 ± 44 | |
a
All binding experiments were performed using adherent CHO cells and HEK293 cells stably transfected with cDNA encoding the appropriate hAR binding was carried out using 1 nM 25, 10 nM 26, 25 nM 27, and 0.2 nM 28 as radioligands for A1, A2A, A2B, and A3ARs, respectively. Values are expressed as mean ± SEM, n ± 3–4 (outliers eliminated), and are normalized against a nonspecific binder, 29.
b
When a percent value is shown, it refers to the percent inhibition of a specific radioligand binding at 10 μM, with nonspecific binding defined using 10 μM of 29.
c
Ref 18.
d
Not determined.