Figure 4.

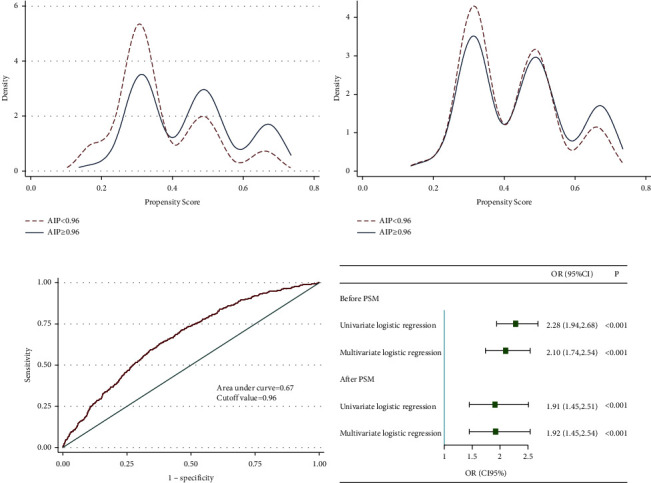
Longitudinal analysis after PSM. (a) Kernel density plot before PSM. (b) Kernel density plot after PSM rather than ROC curve. (c) Receiver operator curve. (d) Forest plot of logistic regression before and after PSM.

Longitudinal analysis after PSM. (a) Kernel density plot before PSM. (b) Kernel density plot after PSM rather than ROC curve. (c) Receiver operator curve. (d) Forest plot of logistic regression before and after PSM.