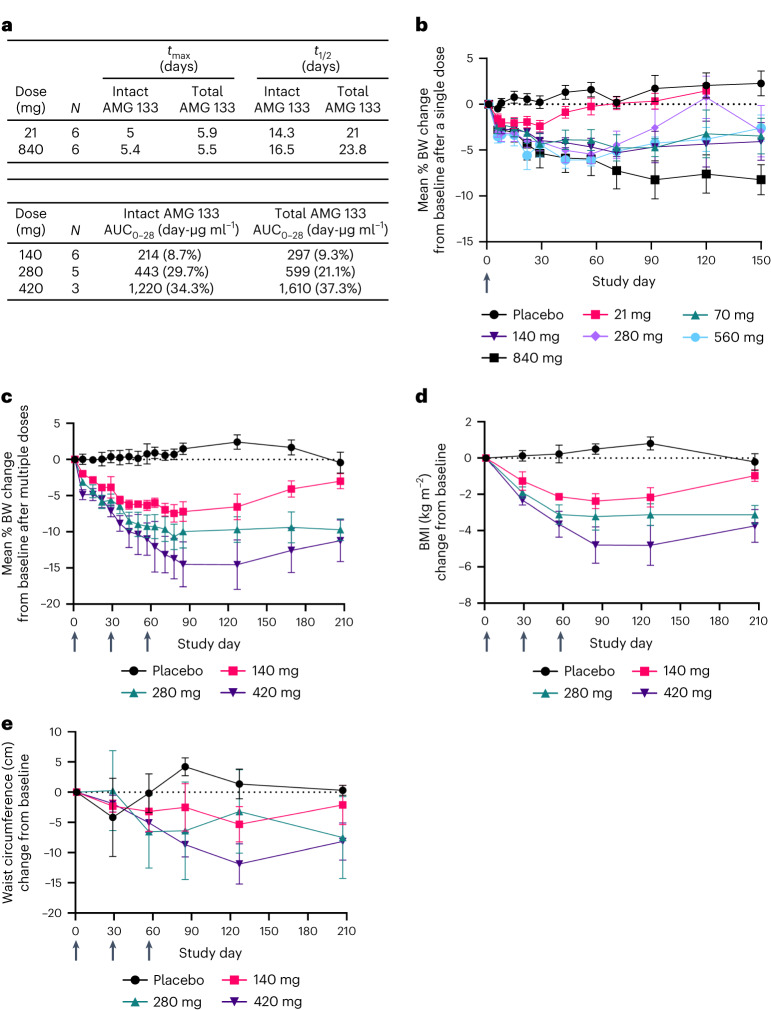
Fig. 4. Clinical PK and PD profiles of AMG 133 in humans.
a, AMG 133 PK parameters; tmax is presented as the median and t1/2 is presented as the geometric mean. AUC0–28 is presented as the geometric mean (CV%) after the last dose of AMG 133 on day 57 for MAD cohorts. b–e, Mean (s.e.m.) percent change from baseline in BW after single doses, n = 6–7 for AMG 133 and n = 12 for placebo at day 1 (b) and multiple doses, n = 6–8 for AMG 133 and n = 6 for placebo at day 1 (c). Mean (s.e.m.) change from baseline in BMI, n = 6–8 for AMG 133 and n = 6 for placebo at day 1 (d) and waist circumference, n = 6–8 for AMG 133 and n = 6 for placebo at day 1 (e) after multiple doses of AMG 133. Arrows indicate when the investigational product was administered: at day 1 in the SAD cohorts (b) and at day 1, 29 and 57 in the MAD cohorts (c–e).

