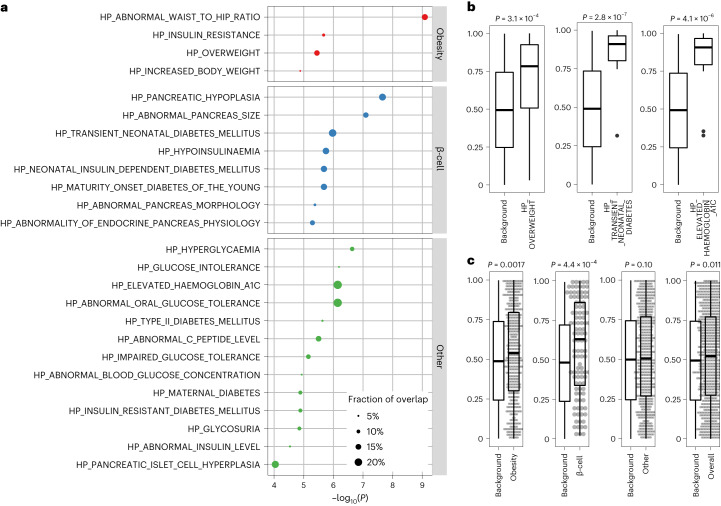
Fig. 2. Pathways involved in obesity and β-cell function are enriched in youth-onset T2D.
a, Gene-set enrichment analysis using a hypergeometric test with the top 50 gene-level association signals in youth-onset T2D identified 25 Human Phenotype Ontology gene sets that had significant overlap and were related to metabolic phenotypes of diabetes. These 25 gene sets were categorized into three subgroups of ‘obesity’, ‘β-cell function’ and ‘others’. b, A one-sided Wilcoxon rank-sum test (one-sided) using these 25 gene sets revealed representative sets with significant association enrichments beyond the top 50 associated genes, such as ‘HP_OVERWEIGHT’ (n = 24 genes versus 1,132 background genes), ‘HP_TRANSIENT_NEONATAL_DIABETES_MELLITUS’ (n = 16 genes versus 750 background genes), and ‘HP_ELEVATED_HAEMOGLOBIN_A1C’ (n = 15 genes versus 705 background genes). c, Gene-set clusters of ‘obesity’ (n = 438 genes versus 1,999 background genes) and ‘β-cell function’ (n = 108 genes versus 519 background genes) showed significant enrichment (P < 0.05) when combining genes across all sets in the cluster using the one-sided Wilcoxon rank-sum test. Background denotes matched genes with similar numbers and frequencies of variants within them. All box-and-whisker plots represent the following: line, median; box, interquartile range (IQR) and whiskers, 1.5 × IQR.

