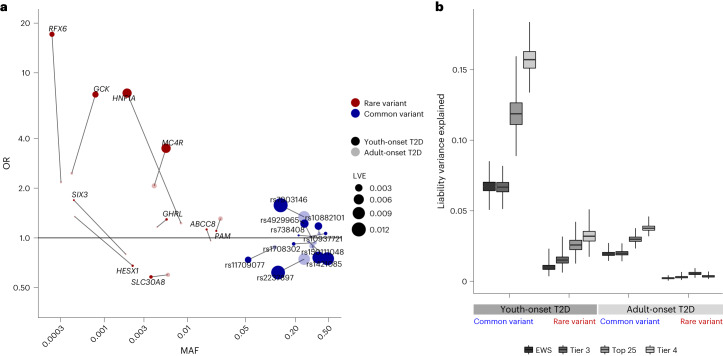
Fig. 3. Genetic architecture and LVE by common and rare variants.
a, OR, allele frequency distribution and LVE by ten tier 3 gene-level association signals and ten common variant association signals and their LVE in youth-onset T2D and adult-onset T2D. b, LVE by common variants and gene-level associations in youth-onset T2D and adult-onset T2D for exome-wide significant associations (EWS), ten tier 3 genes and same number of common variants (tier 3), top 25 significant gene-level and common variant associations (top 25) and 46 tier 4 genes and same number of common variants (tier 4). The LVE by common variants increased by 3.5–4.2-fold in youth-onset T2D compared to adult-onset T2D. There was even larger 5.0–9.0-fold increase in LVE by rare variant gene-level associations in youth-onset T2D. Box-and-whisker plots represent the following: line, median; box, IQR; whiskers, minimum and maximum.

