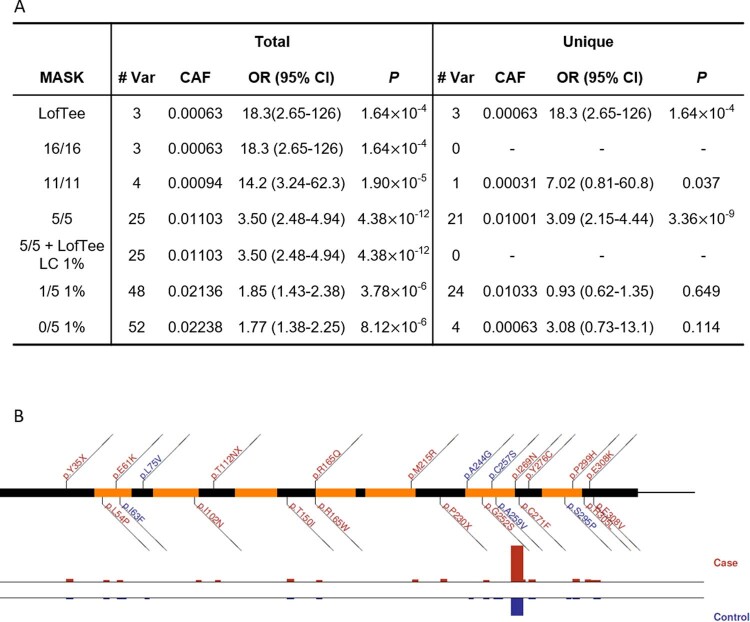
Extended Data Fig. 5. Gene-level analysis of MC4R.
Shown is a dissection of the gene-level associations for MC4R. (A) Mask-level Firth’s logistic regression analysis results for all variants in the mask are shown in the left column (“Total”) and for variants unique to the mask are shown in the right column (“Unique”). The details of the mask definition is described in the Methods. (B) A graphical plot of variants observed in MC4R within the 1/5 1% mask. Variants are coloured blue (if individual OR < 1) or red (OR > 1). Case (red) and control (blue) frequencies are shown below for each variant. # Var, number of variants in the association test; CAF, combined allele frequency; OR, odds ratio.

