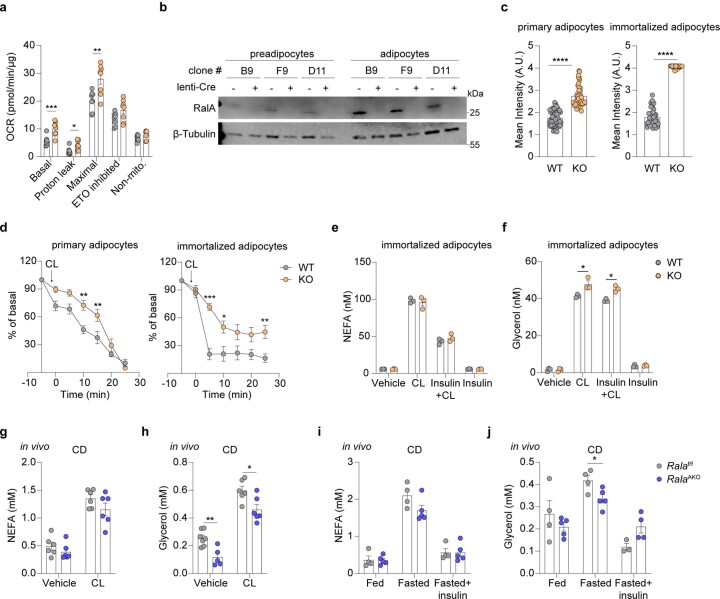
Extended Data Fig. 4. Absence of RalA in adipocytes did not affect free fatty acid release.
a, Calculation of individual OCR in differentiated primary adipocytes (n = 8 biological samples). P = 0.0008, P = 0.0175, P = 0.0042. b, Representative immunoblot of RalA and β-Tubulin in immortalized preadipocytes and differentiated adipocytes. (n = 3 biological samples). c, Quantification of mean TMRM fluorescence intensity in primary adipocytes and immortalized adipocytes (n = 3 independent cells). P < 0.0001, P < 0.0001. d, Time course TMRM intensity quantification in primary and immortalized adipocytes (n = 4 biological samples). Adipocytes were treated with 1 μM CL-316,243 (CL) for indicated times. P = 0.0015, P = 0.0044 (left panel). P < 0.0001, P = 0.0154, P = 0.0095 (right panel). e, f, Quantification of NEFA (e) and free glycerol (f) released into medium from immortalized adipocytes (n = 3 biological samples). Cells were treated with 1 µM CL, 100 nM insulin, or in combination prior to medium collection. P = 0.0301, P = 0.0051 (f). g, h, Plasma levels of NEFA (g) and free glycerol (h) in CD-fed Ralaf/f and RalaAKO mice (n = 6). P = 0.0027, P = 0.0173 (h). Mice were i.p. injected with CL or vehicle prior to blood sampling. i, j, Plasma levels of NEFA (i) and free glycerol (j) in CD-fed Ralaf/f (n = 4) and RalaAKO (n = 5) mice. Mice were either subjected to ad libitum feeding, overnight fasting or fasting plus insulin injection 15 min prior to harvesting. P = 0.0316 (j). The data (a, c-j) are shown as the mean ± SEM, *P < 0.05, **P < 0.01, ***P < 0.001, ****P < 0.0001 by two-tailed Student’s T-test (a, c, e-j) or two-way ANOVA with Bonferroni’s post-test (d).

