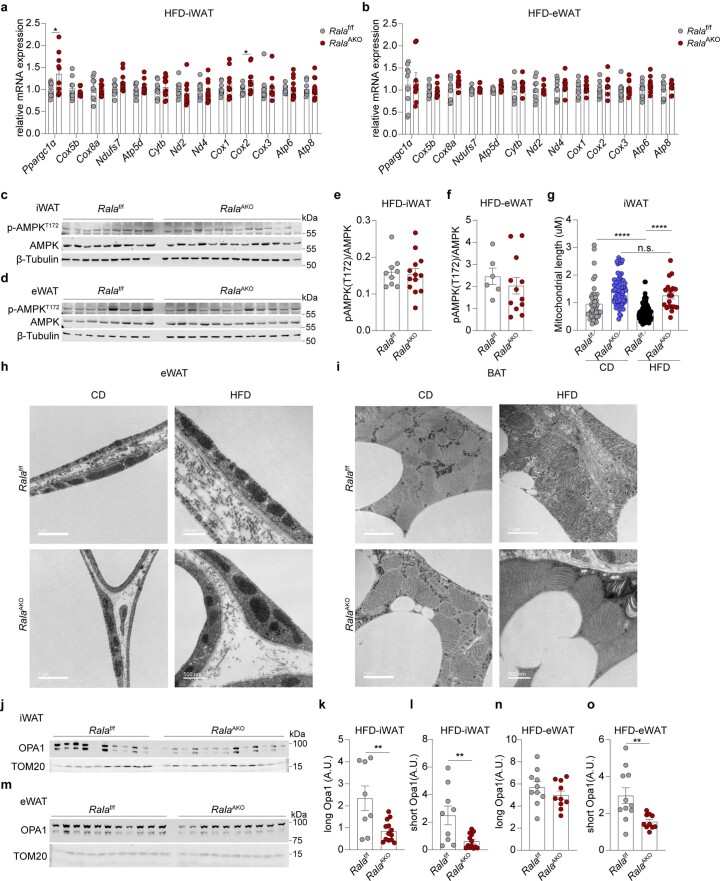
Extended Data Fig. 5. RalA inhibition did not affect mitochondrial biogenesis in WAT.
a, b, Relative mRNA expression of genes corresponding to mitochondrial biogenesis in iWAT (a) and eWAT (b) of HFD-fed Ralaf/f (n = 9) and RalaAKO (n = 10) mice. P = 0.0449, P = 0.0478. (a). c-f, Immunoblotting (c, d) and quantification (e, f) of phospho-AMPK (T172), total AMPK and β-Tubulin in iWAT (Ralaf/f n = 9, RalaAKO n = 14) (c, e) and eWAT (Ralaf/f n = 8, RalaAKO n = 12) (d, f) of HFD-fed mice. g, Maximal mitochondrial length in iWAT of CD-fed and HFD-fed mice (n = 3 biological samples). P < 0.0001, P < 0.0001, P = 0.1675. h, Representative TEM images of mitochondria in eWAT of HFD-fed mice, scale bar = 500 nm. i, Representative TEM images of mitochondria in BAT of HFD-fed mice, scale bar = 1 μm. j-l, Immunoblotting (j) and quantification (k, l) of Opa1 in iWAT of HFD-fed mice (Ralaf/f n = 10, RalaAKO n = 13). P = 0.0045 (k). P = 0.0044 (l). m-o, Immunoblotting (m) and quantification (n, o) of Opa1 in eWAT of HFD-fed mice (Ralaf/f n = 14, RalaAKO n = 10). P = 0.0063 (o). The data (a, b, e-g, k, l, n, o) are shown as the mean ± SEM, *P < 0.05, **P < 0.01, ****P < 0.0001 by two-tailed Student’s T-test (a, g, k, l, o).

