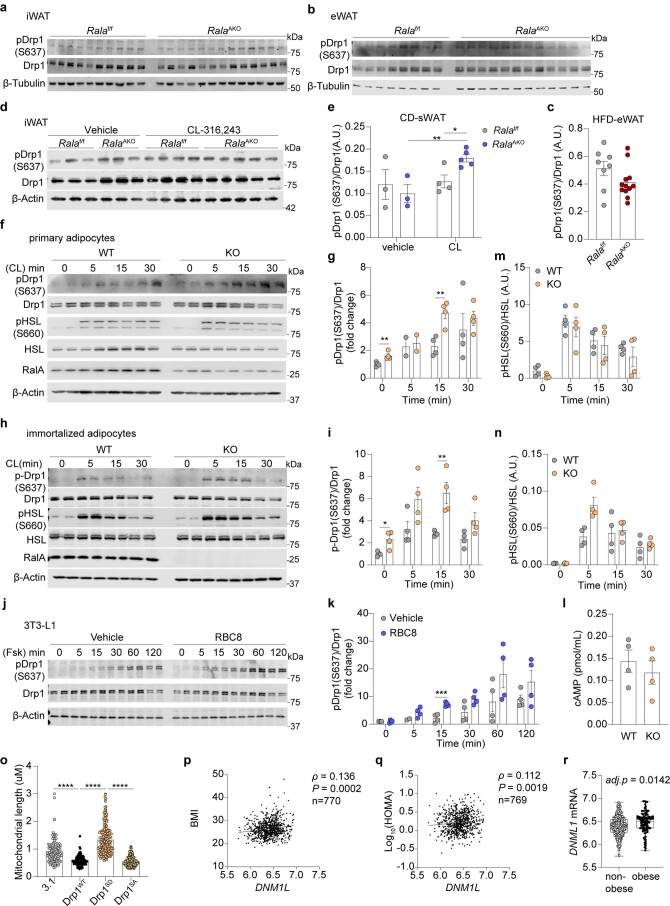
Extended Data Fig. 6. Rala deletion in adipocytes did not affect cAMP production and HSL phosphorylation.
a, Immunoblotting of phospho-Drp1 S637, total Drp1 and β-Tubulin in iWAT of HFD-fed Ralaf/f (n = 10) and RalaAKO (n = 13) mice. b, c, Immunoblotting (b) and quantification (c) of phospho-Drp1(S637), total Drp1, and β-Tubulin in eWAT of HFD-fed Ralaf/f (n = 8) and RalaAKO (n = 12) mice. d, e, Immunoblotting (d) and quantification (e) of phospho-Drp1 (S637), total Drp1 and β-Actin in iWAT of CD-fed mice. Non-fasted Ralaf/f (vehicle n = 3, CL n = 4) and RalaAKO (vehicle n = 3, CL n = 5) mice fed with CD were i.p. injected with 1 mg/kg CL for 30 min. P = 0.0054, P = 0.0135 (e). f, g, Immunoblotting (f) and quantification (g) of phospho-Drp1 (S637), total Drp1, RalA, and β-Actin in fully differentiated primary adipocytes (n = 4 biological samples). P = 0.0085, P = 0.0046 (g). Adipocytes were differentiated from stromal vascular fraction (SVF) isolated from 8-week-old female mice, and were treated with 1 μM CL for indicated time. h, i, Immunoblotting (h) and quantification (i) of phospho-Drp1 (S637), total Drp1, RalA, and β-Actin in immortalized adipocytes (n = 4 biological samples). P = 0.0159, P = 0.0086 (i). Adipocytes were treated with 1 μM CL for indicated time. j, k, Immunoblotting (j) and quantification (k) of phospho-Drp1 (S637), total Drp1, and β-Actin in 3T3-L1 adipocytes (n = 4 biological samples). P = 0.0009 (k). Cells were pretreated with 50 μM RBC8 or DMSO for 30 min, then treated with 5 μM forskolin (Fsk) for indicated time. l, Determination of intracellular cAMP levels in differentiated WT and RalaAKO (KO) primary adipocytes (n = 4 biological samples). Cells were treated with CL for 5 min prior to harvesting. m, n, Quantification of phospho-HSL(S660) and HSL in primary (m) and immortalized adipocytes (n) treated with CL for indicated time (n = 4 biological samples). o, Maximal mitochondrial length in immortalized adipocytes expressing Drp1 mutants (n = 3 independent cells). P < 0.0001 3.1 vs Drp1WT, P < 0.0001 Drp1WT vs Drp1SD, P < 0.0001 Drp1SD vs Drp1SA. p-r, Transcriptomics and clinical data were directly accessed from GEO database (GSE70353). p, q, DNM1L mRNA expression is correlated with BMI (p) and HOMA (q) in human subcutaneous adipose tissue samples (n = 770). P = 0.0002 (p). P = 0.0019 (q). r, Box-and-whisker plot of DNM1L mRNA expression in abdominal subcutaneous adipose tissues from 770 individuals with or without obesity. Benjamini and Hochberg-adjusted P value (adj. p) is 0.014186. The box plot is presented as a box: 25th to 75th percentile, and whiskers: min to max. The data (c, e, g, i, k, l, m, n, o) are shown as the mean ± SEM, *P < 0.05, **P < 0.01, ***P < 0.001, ****P < 0.0001 by two-tailed Student’s T-test (e, g, i, k, o). Significance in correlation was assessed by Spearman’s correlation test (p, q).

