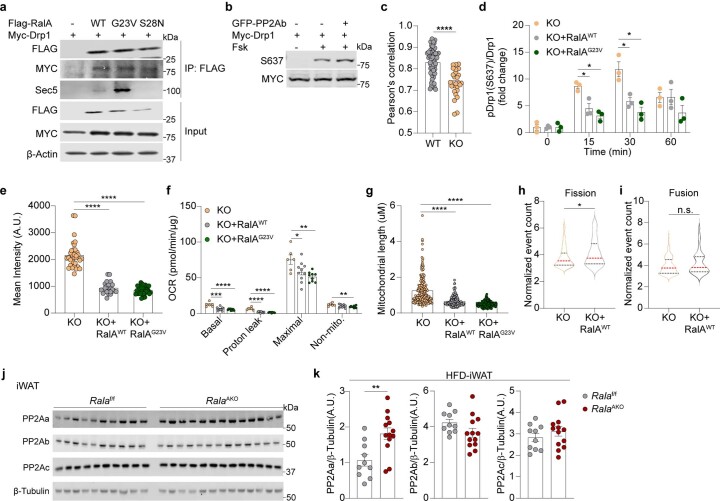
Extended Data Fig. 7. Knockout of RalA increases PP2Aa content.
a, Representative immunoblotting of co-immunoprecipitated between Flag-RalAWT, Flag-RalAG23V, or Flag-RalAS28N and Myc-Drp1 proteins in HEK293T cells. b, Representative in vitro dephosphorylation assay in PP2Ab and Drp1 co-transfected HEK293T cells treated with or without 20 μM forskolin (Fsk) for 1 hr. c, Quantification of Drp1 and RalA co-localization using Pearson’s method (n = 3 independent cells). P < 0.0001. d, Quantification of phospho-Drp1 (S637) and total Drp1 in immortalized RalA KO adipocytes with or without RalA reconstitution (n = 3 biological samples). 15 min: P = 0.0164 KO vs +WT, P = 0.0015 KO vs +GV. 30 min: P = 0.0185 KO vs +WT, P = 0.0087 KO vs +GV. Adipocytes were treated with 20 μM forskolin for indicated time. e, Quantification of TMRM fluorescence intensity in immortalized RalA KO adipocytes with or without RalA reconstitution (n = 3 independent cells). P < 0.0001 KO vs +WT. P < 0.0001 KO vs +GV. f, Calculated OCR in each state from immortalized RalA KO adipocytes with or without RalA reconstitution (WT = 6, +WT = 10, +GV = 9 biological samples). P < 0.0001, P = 0.0423, P = 0.0015, P = 0.0060. g, Maximal mitochondrial length in immortalized adipocytes (n = 3 independent cells). P < 0.0001 KO vs +WT. P < 0.0001 KO vs +GV. h, i, Quantification of fission (h) and fusion (i) events in immortalized adipocytes (KO = 92, +WT = 41). P = 0.0252 (h). P = 0.0879 (i). j, k, Immunoblotting (j) and quantification (k) of PP2Aa, PP2Ab, PP2Ac, and β-Tubulin in iWAT of HFD-fed mice (Ralaf/f n = 10, RalaAKO n = 13). P = 0.0039 (k). The data (c, d, e, f, g, k) are shown as the mean ± SEM, *P < 0.05, **P < 0.01, ***P < 0.001, ****P < 0.0001 by two-tailed Student’s T-test (c, d, e, f, g, h, k).

