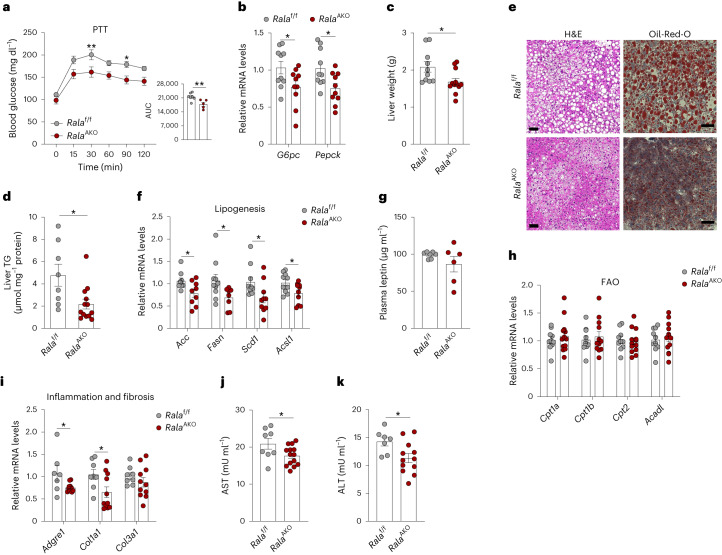
Fig. 2. Loss of RalA in WAT ameliorates HFD-induced hepatic steatosis.
a, A PTT was performed on overnight-fasted Ralaf/f (n = 7) and RalaAKO (n = 5) mice after 8 weeks of HFD feeding; P = 0.0093, P = 0.0241. The AUC was calculated from a PTT longitudinal chart; P = 0.0097. b, Relative mRNA expression of key gluconeogenic genes in livers of HFD-fed Ralaf/f and RalaAKO mice (n = 10). P = 0.0388, P = 0.0167. c, Liver weight of HFD-fed Ralaf/f (n = 10) and RalaAKO (n = 12) mice; P = 0.0235. d, TG content in livers of HFD-fed Ralaf/f (n = 8) and RalaAKO (n = 13) mice; P = 0.0129. e, Representative H&E staining image (left) and Oil-Red-O staining image (right) of liver sections in HFD-fed Ralaf/f and RalaAKO mice (n = 3). Scale bar, 15 mm. f, Relative mRNA expression of lipogenic genes in livers of HFD-fed Ralaf/f (n = 9) and RalaAKO (n = 10) mice; P = 0.0218, P = 0.0435, P = 0.0332, P = 0.0325. g, Plasma leptin levels in HFD-fed Ralaf/f (n = 7) and RalaAKO (n = 6) mice. h, Relative mRNA expression of FAO-related genes in livers of HFD-fed Ralaf/f (n = 10) and RalaAKO (n = 11) mice. i, Relative mRNA expression of genes related to inflammation and fibrosis in livers of HFD-fed Ralaf/f (n = 7) and RalaAKO (n = 11) mice; P = 0.0347, P = 0.0325. j,k, Plasma AST (j) and ALT (k) activities in HFD-fed Ralaf/f (n = 7) and RalaAKO (n = 14) mice; P = 0.0367(j), P = 0.0275 (k). Data (a–d,f–k) show mean ± s.e.m., *P < 0.05, **P < 0.01 by two-tailed Student’s t-test (b–d,f,i–k) or two-way ANOVA with Bonferroni’s post-test (a).

