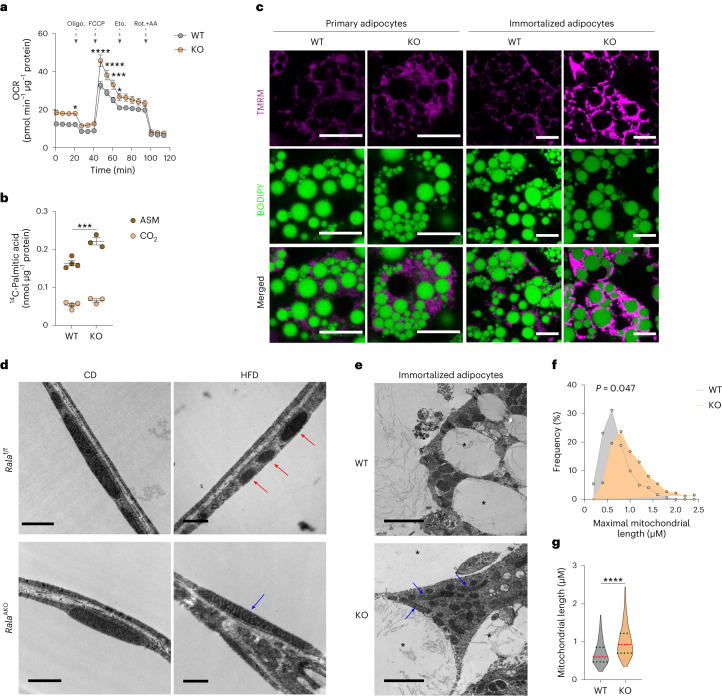
Fig. 4. Rala knockout in white adipocytes increases mitochondrial activity and fatty acid oxidation via preventing obesity-induced mitochondrial fission in iWAT.
a, OCR was measured in fully differentiated primary adipocytes (n = 8 biological samples); P = 0.0499, P < 0.0001, P < 0.0001, P = 0.0006, P = 0.0468. Vertical arrows indicate injection ports of indicated chemicals. b, 14C-PA oxidation in differentiated primary WT (n = 4 biological samples) and KO (n = 3 biological samples) adipocytes under basal conditions; P = 0.0037. c, Representative confocal images of live primary and immortalized adipocytes stained with TMRM (red) and BODIPY (green) (n = 3 biological samples). Scale bar, 15 μm. d, Representative transmission electron microscope (TEM) images of iWAT from CD-fed and HFD-fed Ralaf/f and RalaAKO mice (n = 3 biological samples). Red arrow indicates fissed mitochondria; blue arrow indicates elongated mitochondria. Scale bar, 1 μm (CD) or 500 nm (HFD). e, Representative TEM images of WT and Rala KO immortalized adipocytes (n = 3 biological samples). Blue arrow indicates elongated mitochondria; asterisk indicates lipid droplet. Scale bar, 2 μm. f,g, Histogram (f) and violin plot (g) of maximal mitochondrial length in immortalized adipocytes (WT, six independent cells; KO, ten independent cells). Violin plot is presented as violin showing 25th to 75th percentiles and whiskers showing min to max; P = 0.047 (f), P < 0.0001 (g). Data (a,b) show mean ± s.e.m., *P < 0.05, ***P < 0.001, ****P < 0.0001 by two-tailed Student’s t-test (b,g), two-way ANOVA alone (f) or with Bonferroni’s post-test (a).

