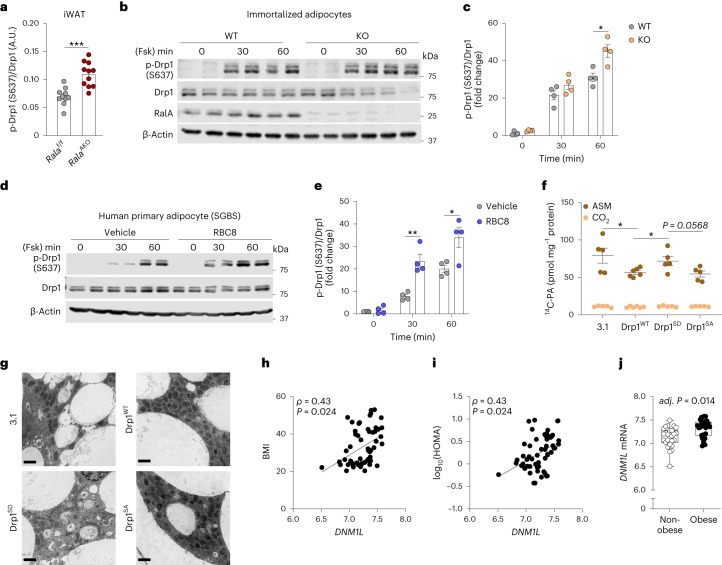
Fig. 5. Inhibition of RalA increases Drp1 S637 phosphorylation in white adipocytes.
a, Quantification of phospho-Drp1 (S637) and total Drp1 in iWAT of HFD-fed Ralaf/f (n = 10) and RalaAKO (n = 13) mice; P = 0.0001. b,c, Immunoblotting (b) and quantification (c) of phospho-Drp1 (S637) and total Drp1 in immortalized adipocytes (n = 4 biological samples); P = 0.0125 (c). Adipocytes were treated with 20 μM forskolin (Fsk) for indicated time. d,e, Immunoblotting (d) and quantification of phospho-Drp1 (S637) and total Drp1 in human primary adipocytes (SGBS) (n = 4 biological samples). Cells were pretreated with 50 μM RBC8 or dimethylsulfoxide (DMSO) for 30 min before treatment with 20 μM forskolin (Fsk) for indicated time; P = 0.0022, P = 0.0244 (e). f, Basal 14C-PA oxidation in WT immortalized adipocytes transfected with indicated plasmids (n = 6 biological samples); P = 0.040 3.1 versus Drp1WT, P = 0.0364 Drp1WT versus Drp1SD. g, Representative TEM images of immortalized adipocytes transfected with indicated plasmids (n = 3 biological samples). Scale bar, 2 μM. h,i, DNM1L mRNA expression is correlated with BMI (h) and HOMA (i) in human abdominal subcutaneous adipose tissue samples (n = 56 biological samples). ρ (rho) denotes Spearman’s rank-order correlation coefficient of the regression; P = 0.024 (h), P = 0.024 (i). j, Box-and-whisker plot of DNM1L mRNA expression in abdominal subcutaneous adipose tissues from 56 individuals with or without obesity. Benjamini–Hochberg adj. P = 0.014. The box plot is presented as a box showing 25th to 75th percentiles and whiskers showing min to max. Data (a,c,e,f) show mean ± s.e.m., *P < 0.05, **P < 0.01, ***P < 0.001 by two-tailed Student’s t-test (a,c,e,f). Significance in correlation was assessed by Spearman’s correlation test (h,j).

