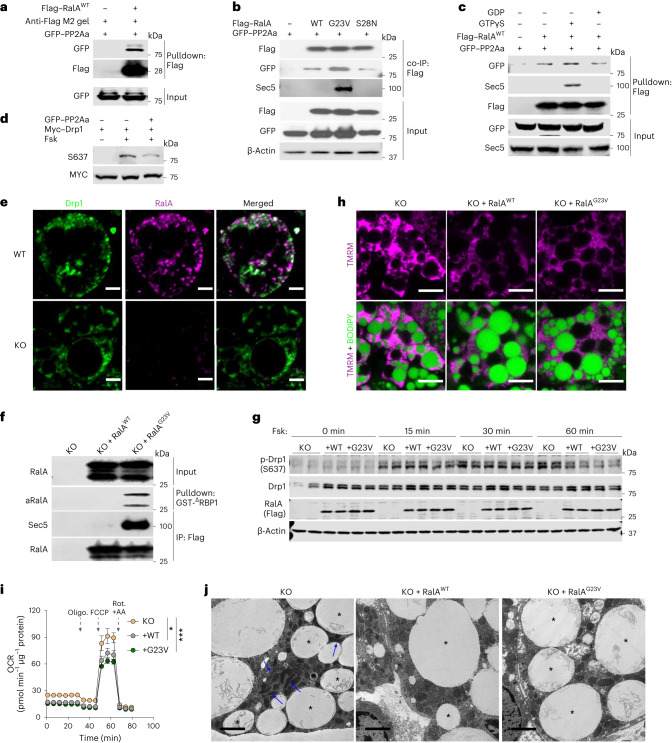
Fig. 6. RalA interacts with Drp1 and protein phosphatase 2A, promoting dephosphorylation of Drp1 at S637.
a, Representative immunoblotting of pulldown assay determining PP2Aa–RalA interactions. b, Representative immunoblotting of co-immunoprecipitation (co-IP) determining the interaction between RalA WT, constitutive active (G23V) or dominant negative (S28N) mutants and PP2Aa in HEK293T cells. c, Representative immunoblotting of pulldown and in vitro loading assay determining interaction between PP2Aa and GTP/GDP-loaded RalA. Purified Flag–RalAWT protein loaded with either GTPγS or GDP was, respectively, used as a bait to pull down GFP–PP2Aa from HEK293T cells. d, Representative immunoblotting of in vitro dephosphorylation assay in HEK293T cells co-transfected with PP2A and Drp1 plasmids. Cells were treated for 1 h with 20 μM forskolin (Fsk) or vehicle. e, Representative immunofluorescent staining of endogenous Drp1 and RalA in immortalized WT adipocytes. Scale bar, 5 μm. f, Representative immunoblotting of RalA activity assay in immortalized Rala KO adipocytes reconstituted with RalAWT and RalAG23V. g, Immunoblotting of phospho-Drp1 (S637), total Drp1, Flag-tagged RalA and β-actin in immortalized Rala KO adipocytes with or without RalA reconstitution (n = 3 independent experiments). Adipocytes were treated with 20 μM forskolin for the indicated times. h, Representative confocal images of live immortalized adipocytes (n = 3 biological independent cells) stained with TMRM (red) and BODIPY (green). Scale bar, 15 μM. i, OCR was measured by Seahorse in immortalized adipocytes (KO, n = 5 independent samples; +WT, n = 10 independent samples; +G23V, n = 9 independent samples); P = 0.0165 KO versus +WT, P = 0.0005 KO versus +G23V. Vertical arrows indicate injection ports of indicated chemicals. Data are shown as mean ± s.e.m., *P < 0.05, ***P < 0.001 by two-way ANOVA. j, Representative TEM images of Rala KO immortalized adipocytes with or without RalA reconstitution (n = 3 independent cells). Blue arrow indicates elongated mitochondria; asterisk indicates lipid droplet. Scale bar, 2 μm.

