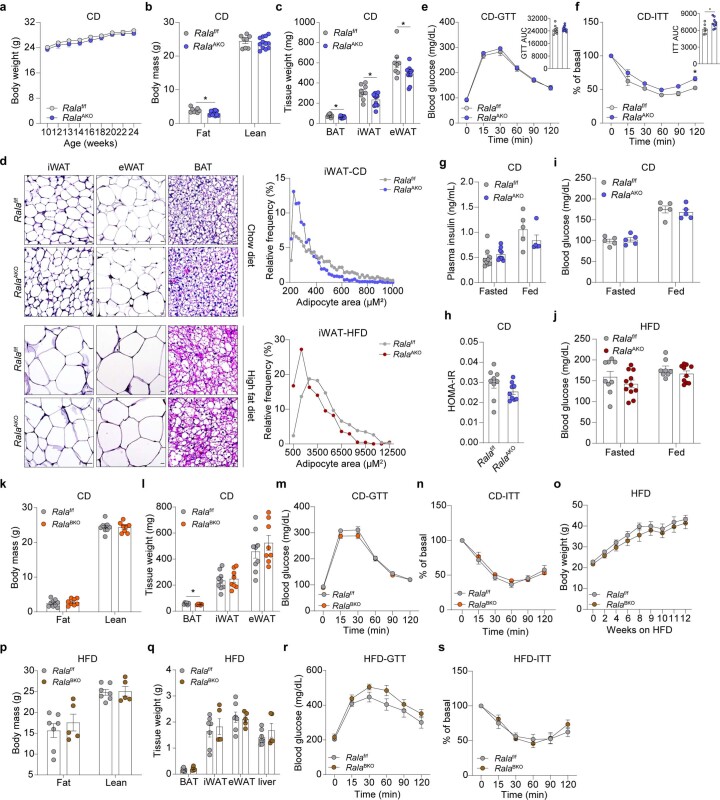
Extended Data Fig. 2. Brown adipocyte specific Rala deletion in mice did not phenocopy RalaAKO mice.
a-c, Body weight curve (a), body composition (b) and fat depot weights (c) of CD-fed Ralaf/f (n = 8) and RalaAKO (n = 12) mice at the age of 24-weeks. P = 0.0103 (b). P = 0.0122, P = 0.0252, P = 0.0403 (c). d, Representative H&E staining images of iWAT, eWAT, and BAT from CD-fed and HFD-fed mice (n = 3), scale bar = 100 μm, representative adipocytes size quantification of iWAT from CD-fed and HFD-fed mice. e, f, Glucose tolerance test (GTT, e) and insulin tolerance test (ITT, f) on CD-fed Ralaf/f (n = 8) and RalaAKO (n = 12) mice. Area under curves (AUC) were calculated from GTT and ITT, respectively. P = 0.0247 (f). g, Plasma insulin levels in CD-fed Ralaf/f and RalaAKO mice under ab libitum (n = 5) or overnight fasted (n = 9) condition. h, Homeostasis model assessment-estimated insulin resistance (HOMA-IR) was calculated based on fasting glucose and insulin levels from CD-fed Ralaf/f and RalaAKO mice (n = 9). I, Blood glucose levels in CD-fed mice (n = 5) at indicated states. j, Blood glucose levels in HFD-fed Ralaf/f (n = 9) and RalaAKO (n = 11) mice at indicated states. k-l, Body composition (k) and fat depot weights (l) in CD-fed Ralaf/f (n = 9) and RalaBKO (n = 8) mice at the age of 28 weeks. P = 0.0488 (l). m-n, GTT (m) and ITT (n) were performed in CD-fed Ralaf/f (n = 9) and RalaBKO (n = 8) mice at the age of 26-weeks. o, Body weight curve of Ralaf/f (n = 6) and RalaBKO (n = 4) mice fed with HFD for 12 weeks. p-q, Body composition (p) and fat depot and liver weights (q) in HFD-fed Ralaf/f (n = 7) and RalaBKO (n = 5) mice at the age of 20-21 weeks. r, s, GTT (r) and ITT (s) were performed in HFD-fed Ralaf/f (n = 7) and RalaBKO (n = 5) mice at the age of 17-weeks or 20-weeks, respectively. The data are presented as the mean ± SEM (a-c, e-s), *P < 0.05 by two-tailed Student’s T-test (b, c, f, l) or two-way ANOVA with Bonferroni’s post-test (a, e, f, m-o, r, s).

