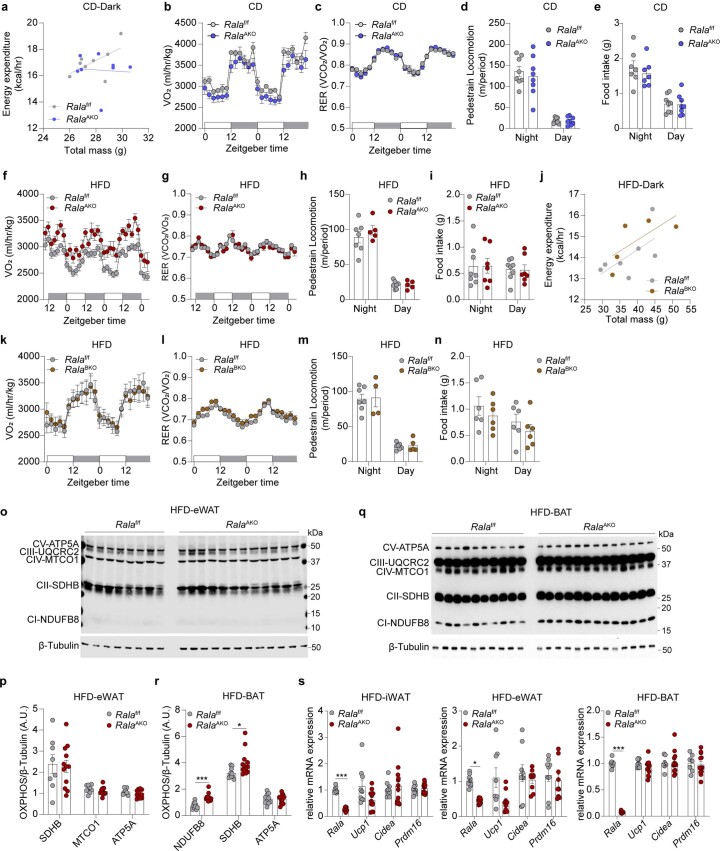
Extended Data Fig. 3. Neither CD-fed RalaAKO mice nor HFD-fed RalaBKO mice show increased energy expenditure.
a, Regression plot of energy expenditure (EE) during dark phase against body weight (BW) in CD-fed Ralaf/f and RalaAKO mice (n = 8). ANCOVA test using BW as a covariate, group effect P = 0.2805. b-e, BW-normalized oxygen consumption (b), respiratory exchange ratio (RER) (c), pedestrian locomotion (d) and food intake (e) over a two-days period were measured in CD-fed Ralaf/f and RalaAKO mice (n = 8) by metabolic cages. f-i, BW-normalized oxygen consumption (f), respiratory exchange ratio (RER) (g), pedestrian locomotion (h) and food intake (i) over a two-days period were measured in HFD-fed Ralaf/f (n = 8) and RalaAKO (n = 5) mice by metabolic cages. j, Regression plot of EE during dark phase against BW in HFD-fed Ralaf/f (n = 7) and RalaBKO (n = 5) mice. ANCOVA test using BW as a covariate, group effect P = 0.2792. k-n, BW-normalized oxygen consumption (k), respiratory exchange ratio (RER, l), pedestrian locomotion (m) and food intake (n) over a two-days period were measured in HFD-fed Ralaf/f (n = 7) and RalaBKO (n = 5) mice by metabolic cages. (o, p) Immunoblotting (o) and quantification (p) of OXPHOS proteins in eWAT of HFD-fed mice (Ralaf/f n = 8 and RalaAKO n = 12). (q, r) Immunoblotting (q) and quantitation (r) of OXPHOS proteins in BAT of HFD-fed mice (Ralaf/f n = 10 and RalaAKO n = 13). P < 0.0001, P = 0.0252 (r). s, Relative mRNA expression of browning-related genes in iWAT, eWAT and BAT of HFD-fed mice (Ralaf/f n = 8 and RalaAKO n = 13). P < 0.0001, P < 0.0001, P < 0.0001. The data (b-i, k-n, p-s) are shown as the mean ± SEM, *P < 0.05, ***P < 0.001 by two-tailed Student’s T-tesI (d, e, h, i, m, n, p-s), or two-way ANOVA with Bonferroni’s post-test (b, c, f, g, k, l).

