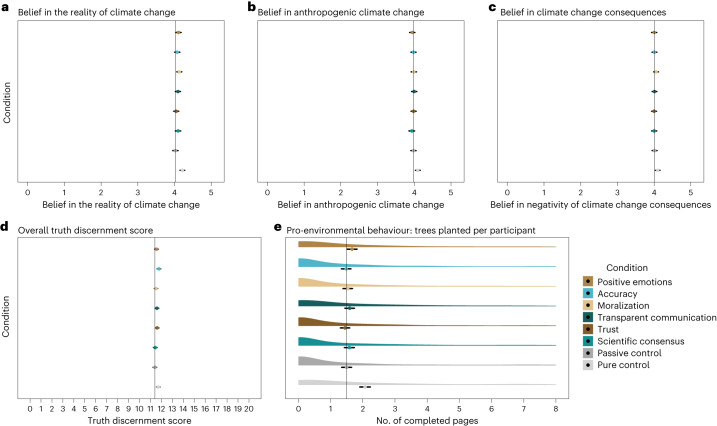
Fig. 2. Variables of interest, by condition (N = 6,816).
a, Belief in the reality of climate change162 (N = 6,816). The x axis represents mean belief in climate change. Passive disinformation control condition: two-sided t-test; t(1,689.62) = −3.990; P < 0.001; δ = −0.19; 95% CI, (−0.28, −0.10). Contrast between conditions: F(6, 5,901.1) = 1.1460, P = 0.33. b, Belief in the anthropogenic nature of climate change162. The x axis represents mean belief in anthropogenic climate change. Passive disinformation control condition: two-sided t-test; t(1,705.95) = −2.496; P = 0.013; δ = −0.12; 95% CI, (−0.21, −0.03). Contrast between inoculation and passive disinformation control conditions: F(6, 5,901.1) = 0.3824, P = 0.89. c, Belief in the negativity of the consequences of climate change162 (N = 6,816). The x axis represents mean belief in the negativity of climate change consequences. Passive disinformation control condition: equivalence test; t(1,708.79) = 2.205; P = 0.014; 90% CI, (−0.01, −0.16). Contrast between conditions: F(6, 5,901.1) = 0.2911, P = 0.94. d, Climate truth discrimination score163 (N = 6,816). The x axis represents the mean number of correct categorizations of true and false statements about climate change. Passive disinformation control condition: two-sided t-test; (t(1,717.26) = −2.877; P = 0.004; δ = −0.14; 95% CI, (−0.52, −0.10). Accuracy inoculation: one-sided t-test; t(5,936.2) = 3.360; P < 0.001; β = 0.36; 95% CI, (0.15, 0.57). Scientific consensus inoculation: equivalence test; t(1,670.06) = −3.782; P < 0.001; 90% CI, (−0.15, 0.22). Trust inoculation: equivalence test; t(1,705.24) = −2.195; P = 0.014; 90% CI, (−0.03, −0.39). Transparent communication inoculation: equivalence test; t(1,697.78) = −2.387; P = 0.009; 90% CI, (−0.01, −0.37). Moralization inoculation: equivalence test; t(1,726.29) = −3.151; P = 0.001; 90% CI, (−0.07, 0.29). Positive emotions inoculation: equivalence test; t(1,701.69) = −2.759; P = 0.003; 90% CI, (−0.03, 0.37). e, WEPT performance164; the response distribution is shown to highlight the flooring effect (N = 6,816). The x axis represents the mean number of WEPT pages participants completed with 90% accuracy (a preregistered inclusion criterion)—that is, trees planted per participant. Passive disinformation control condition: two-sided t-test; t(1,713.68) = −5.030; P < 0.001; δ = −0.24; 95% CI, (−0.80, −0.39). Contrast between conditions: χ(6) = 11.7805, P = 0.07. In each panel, the y axis represents the experimental conditions: pure control condition (light grey), passive control condition (dark grey), scientific consensus inoculation (light green), trust inoculation (dark brown), transparent communication inoculation (dark green), moralization inoculation (gold), accuracy inoculation (light blue) and positive emotions inoculation (light brown). The error bars represent the mean-centred 95% CIs. Colour palette by the MetBrewer package169.

