Fig. 1.
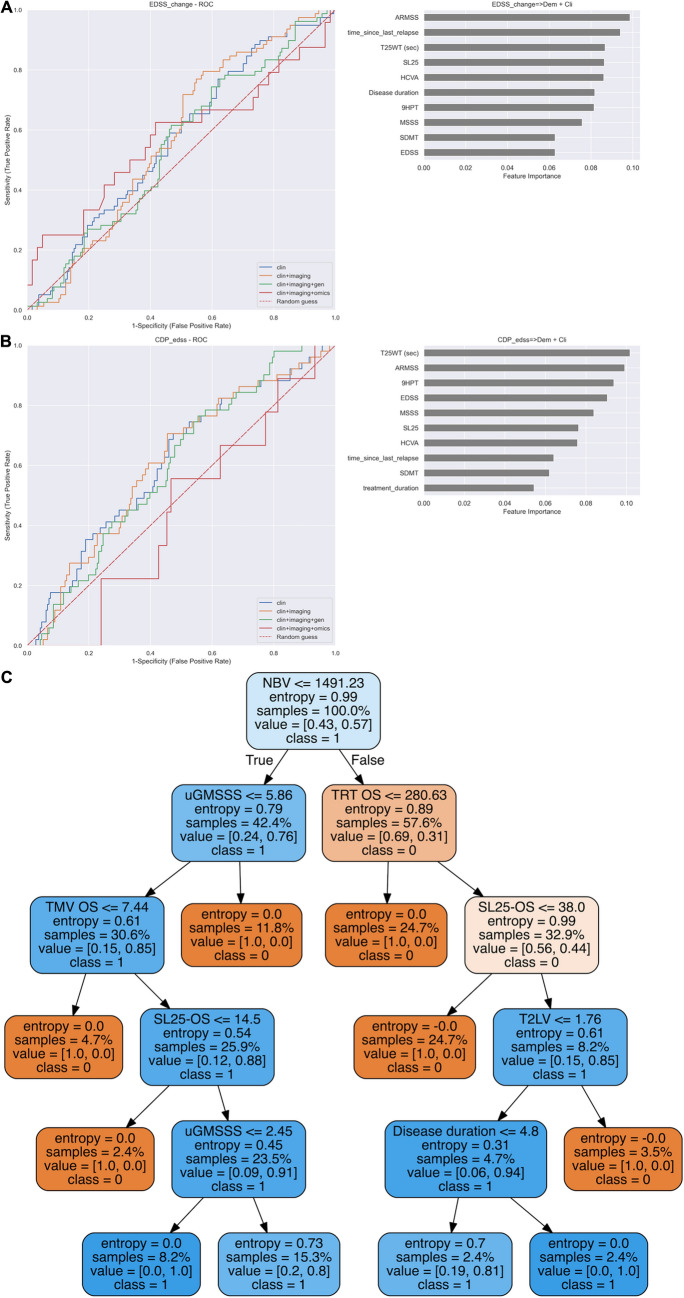
Performance of random forest algorithm for predicting the EDSS at 2-year follow-up. A ROC curve showing 6-month confirmed EDSS accumulation at the end of follow-up using: (1) clinical features (blue); (2) clinical and imaging (MRI and OCT) features (orange); or (3) clinical, imaging and omics features (green); the random classification is shown in red. B Representative tree of the random forest for predicting 6-month confirmed EDSS accumulation. Each box of the decision trees shows the following information: (1) feature of the tree: based on the result, it either follows the true or the false path; (2) entropy, a measure of disorder or uncertainty that is reduced by the algorithm; (3) samples: percentage of samples that fall in that node; (4) value: the proportion of samples that falls in each category (class); and (5) class. C discriminatory features by order of relevance (top to down) for the best predictors of EDSS-CDA based on the AUC using: a clinical, b clinical and imaging, c clinical, imaging and genetics, and d Clinical, imaging, genetics and omics features

