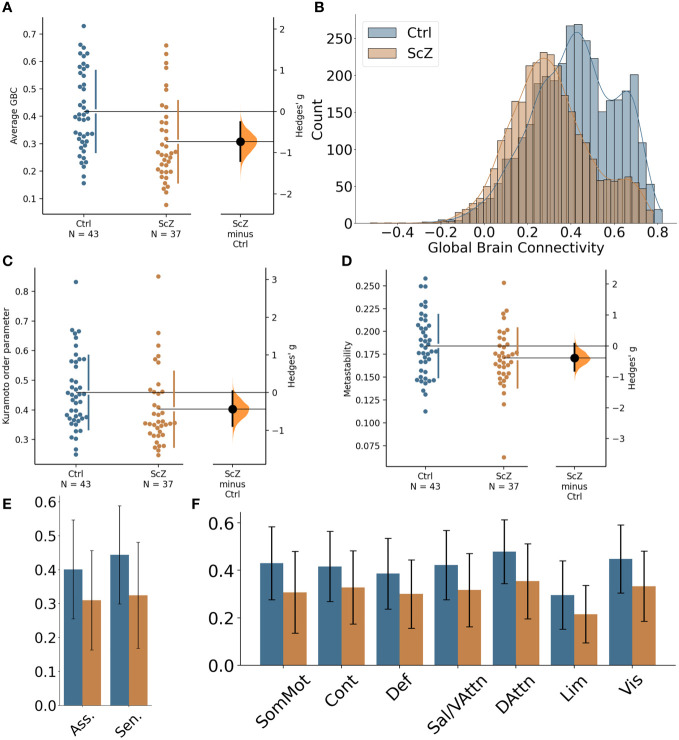
Figure 1.
Global differences in functional connectivity and temporal dynamics between healthy controls and ScZ patients. (A) Comparison of average GBC per participant for the two groups. Individual dots represent average GBC for one participant. The difference plot on the right shows the difference between the groups in terms of effect size. (B) Histogram of region-wise GBC values for the two groups. The histogram displays the region-wise GBC data pooled for all participants in each group. (C) Synchrony comparison between the two groups. Each dot represents the mean Kuramoto order parameter (a measure of synchrony) for one participant. The difference plot on the right shows the group difference in terms of effect size. (D) Metastability comparison between the two groups. Each dot represents the metastability of one participant. The difference plot on the right shows the group difference in terms of effect size. (E) Comparison of global brain connectivity for association areas (Asso. comprising: DMN, Cont, Sal/VAttn) and sensory areas (Sen. comprising: Sommot, Vis, DAttn). (F) Comparison of global brain connectivity for the seven functional networks from Yeo et al. (53): SomMot, Somato-motor subnetwork; Cont, Control subnetwork; Def, Default mode subnetwork; Sal/VAttn, Salience/Ventral attention subnetwork; DAttn, Dorsal attention subnetwork; Lim, Limbic subnetwork; Vis, Visual subnetwork.

