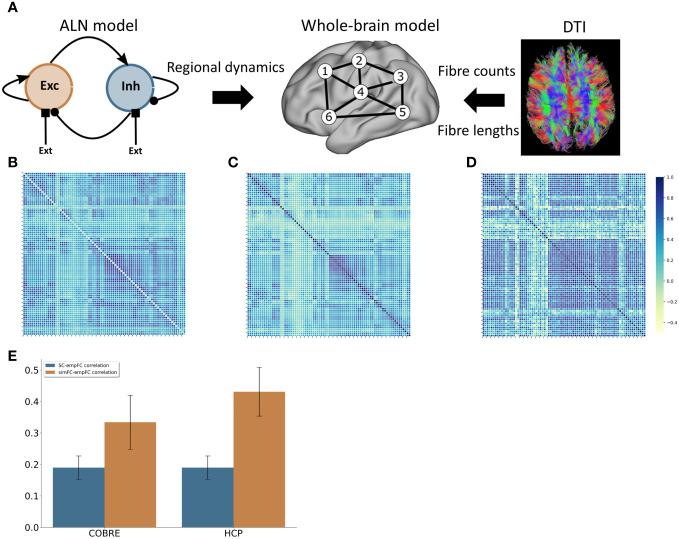
Figure 2.
Computational model (A) Modelling approach combining a model for the regional dynamics with anatomical input that defines the structural network. (B) Average FC matrix for the COBRE sample (C) Average FC matrix for the HCP sample (D) Model FC matrix (E) comparison of the correlation of empSC to empFC (blue) and the correlation of simFC and empFC (yellow) for the COBRE (left) and the for the HCP (right) data sets.

