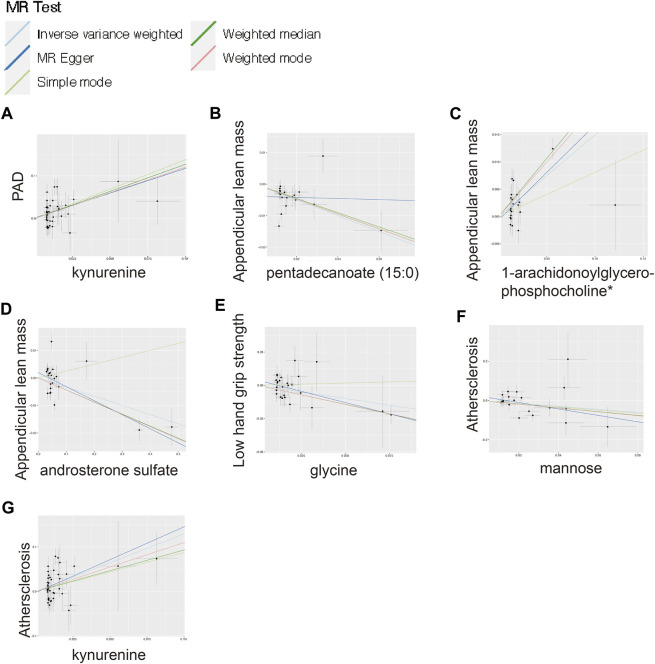
FIGURE 4.
Scatter plot for the significant MR associations. (A) Scatter plot for the significant MR association between kynurenine and PAD. (B) Scatter plot for the significant MR association between appendicular lean mass and pentadecanoate (15:0). (C) Scatter plot for the significant MR association between appendicular lean mass and 1-arachidonoylglycerophosphocholine*. (D) Scatter plot for the significant MR association between appendicular lean mass and androsterone sulfate. (E) Scatter plot for the significant MR association between low hand grip strength and glycine. (F) Scatter plot for the significant MR association between atherosclerosis and mannose. (G) Scatter plot for the significant MR association between atherosclerosis and kynurenine.

