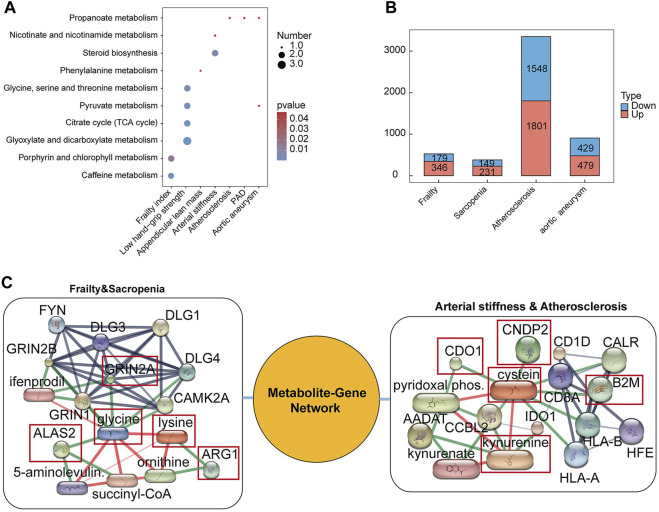
FIGURE 6.
Metabolic pathway analysis of differential serum metabolites and genes in diseases. (A) The metabolic pathways of differential metabolites in diseases. The number size represents the amount of metabolites enriched in the metabolic pathway. (B) Differential expression gene numbers. (C) The network of metabolite-gene-.disease.

