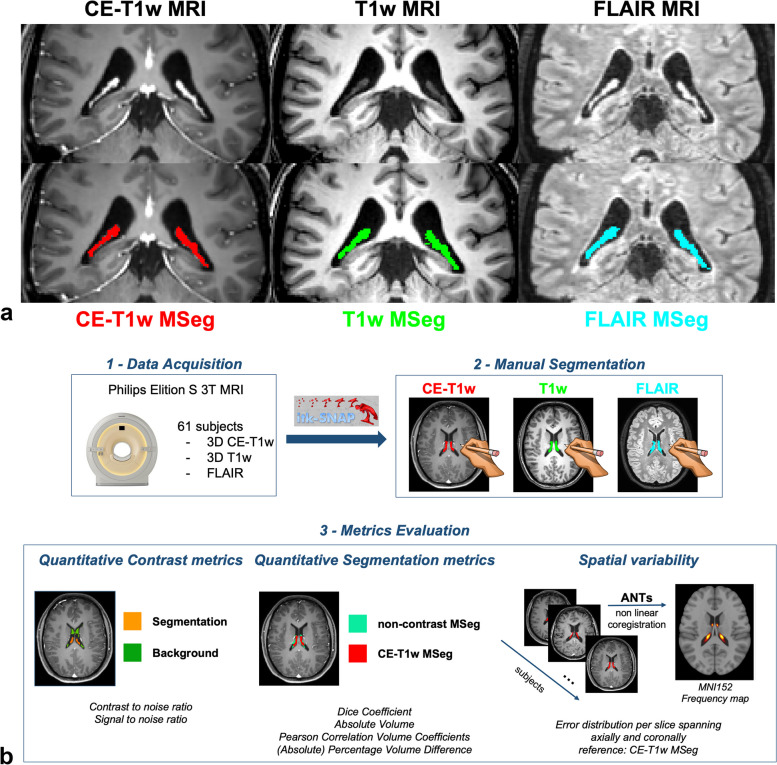
Fig. 1.
a Coronal view of choroid plexus of a representative patient. First row, from left to right: contrast-enhanced (CE) T1-weighted (T1w), non-CE T1w, and fluid-attenuated inversion-recovery (FLAIR) sequences. Second row, from left to right; previous images with overlapped, respectively, CE-T1w manual segmentation (MSeg) in red, T1w MSeg in green, and FLAIR MSeg in blue. b Study workflow: (1) data acquisition (for details, see the “Data acquisition” section); (2) MSeg performed by neuroradiologists on ITK-snap for each available sequence for each subject (for details, see the “Manual segmentation and inter-rater agreement” section); (3) metrics evaluation: analyses performed in the study (for details, see the “Quantitative contrast metrics,” “Quantitative segmentation metrics,” and “Spatial variability” sections). ANTs, Advanced Normalization Toolbox

