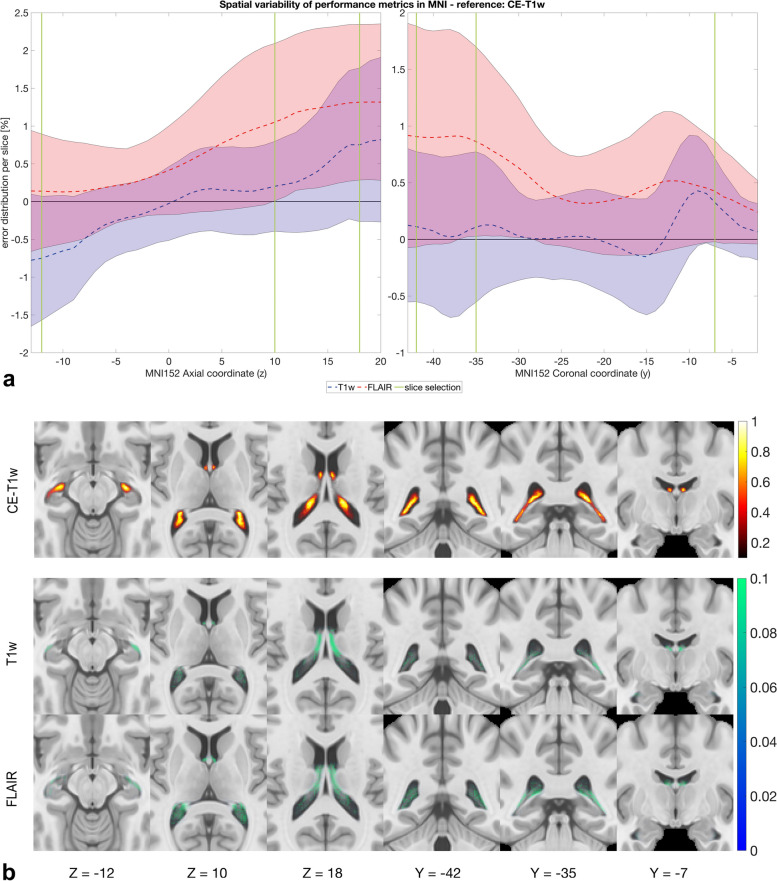
Fig. 3.
a Slice-wise evaluation of performance metrics in MNI Talairach ICBM 152 2009c nonlinear symmetric template (MNI152) coordinate system. The graph represents the error distribution per slice between non-contrast-enhanced (CE) manual segmentations (MSegs)—fluid-attenuated inversion-recovery (FLAIR) in red, T1-weighted (T1w) in blue—and the reference CE-T1w computed axial-wise along the z-coordinate (on the left) and coronal-wise along the y-coordinate (on the right) of the MNI152 coordinate system. The vertical green lines highlight three representative axial (z = -12: temporal horn near the head of the hippocampus; z = 10: atrium of the lateral ventricle; z = 18: body of the lateral ventricles near the fornix) and coronal (y = -35: anterior portion of the atrium of the lateral ventricles; y = -42: posterior portion of the atrium of the lateral ventricles; y = -7: anterior portion of the fornix) slices reported in b. b Probability frequency maps of MSegs overlapped to the MNI Talairach ICBM 152 2009c nonlinear symmetric template (MNI152). From left to right, three axial views (z = -12: temporal horn near the head of the hippocampus; z = 10: atrium of the lateral ventricle; z = 18: body of the lateral ventricles near the fornix) and three coronal views (y = -35: anterior portion of the atrium of the lateral ventricles; y = -42: posterior portion of the atrium of the lateral ventricles; y = -7: anterior portion of the fornix). Reported coordinates are centered at the origin of the MNI space. The first row represents the frequency map of the CE-T1w MSeg for representative slices overlapped to the MNI152 template. The second and third rows show the difference between the frequency map of MSegs depicted on non-CE sequences (T1w and FLAIR) and the MSeg obtained from the CE-T1w sequence overlapped to the MNI152, respectively

