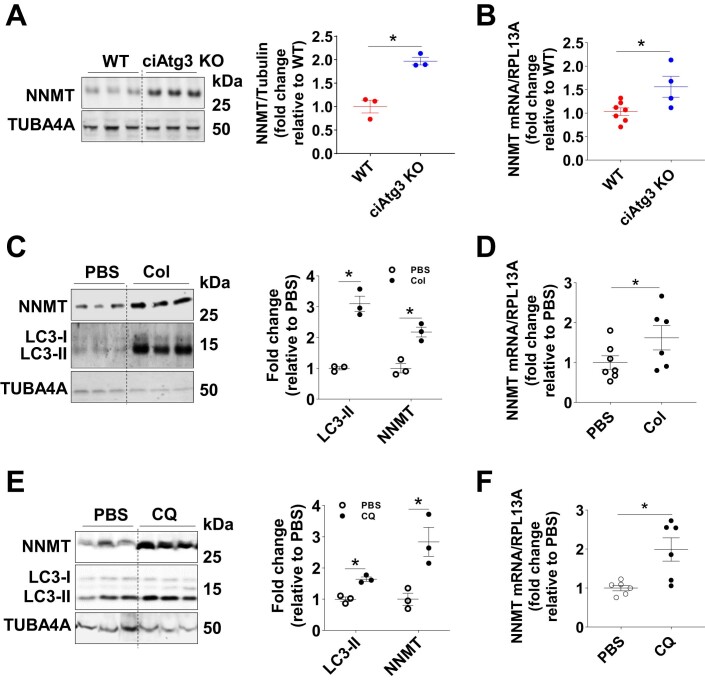
Figure EV4. CAtg3-KO upregulates NNMT expression in hearts, related to Fig. 5.
(A) NNMT protein levels in WT and ciAtg3 KO mice 1 week after last tamoxifen injection. n = 3 per group. Data are mean ± SEM. An unpaired t test was used to determine statistical significance between two groups. *P < 0.05. (B) NNMT mRNA levels in WT and ciAtg3 KO mice 1 week after last tamoxifen injection. n = 4–7 per group. Data are mean ± SEM. An unpaired t test was used to determine statistical significance between two groups. *P < 0.05. (C) NNMT and LC3 (MAP1LC3A) protein levels in hearts of WT mice following treatment with PBS, or Colchicine (Col), n = 3 per group. Data are mean ± SEM. An unpaired t test was used to determine statistical significance between two groups. *P < 0.05. (D) NNMT mRNA levels in hearts of WT mice following treatment with PBS, or Colchicine (Col). n = 6–7 per group. Data are mean ± SEM. An unpaired t test was used to determine statistical significance between two groups. *P < 0.05. (E) NNMT and LC3 protein levels in hearts of WT mice following treatment with PBS, or Chloroquine (CQ). n = 3 per group. Data are mean ± SEM. An unpaired t test was used to determine statistical significance between two groups. *P < 0.05. (F) NNMT mRNA levels in hearts of WT mice following treatment with PBS, or CQ. n = 6 per group. Data are mean ± SEM. An unpaired t test was used to determine statistical significance between two groups. *P < 0.05. Source data are available online for this figure.

