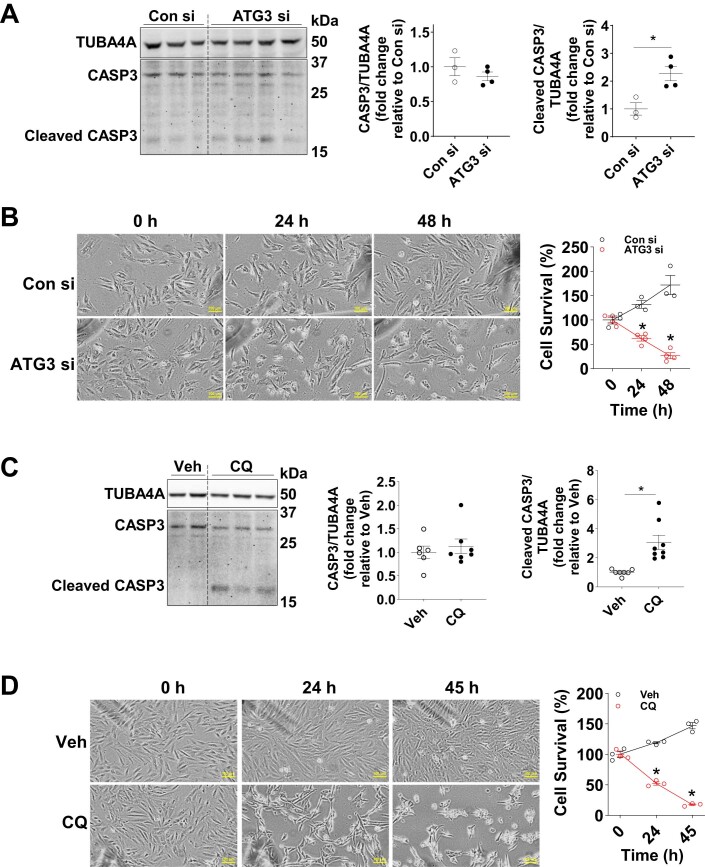
Figure EV5. Cell death under conditions of defective autophagy, related to Fig. 6.
(A) Protein levels of CASP3 (Caspase3), Cleaved CASP3, and TUBA4A (alpha-tubulin) in H9c2 cells transfected with ATG3 siRNA. ATG3 siRNA was added to cells for ~48 h prior to harvesting cells for western blot. n = 3–4 per group. Data are mean ± SEM. Unpaired t tests were used to determine statistical significance between two groups. *P < 0.05. (B) Cell death in H9c2 cells cultured in nutrient-replete medium. H9c2 cells were transfected with ATG3 siRNA for ~48 h. Then, the cells were moved to the growth medium (high-glucose DMEM supplemented with 10% FBS), and the images in the same location in each well were captured at the end of siRNA transfection (T0) and then at 24 h and 48 h thereafter. n = 3–4 images at each time point per group. Data are mean ± SEM. Unpaired t tests were used to determine statistical significance between two groups at corresponding time points. *P < 0.05 vs. Con si-treated H9c2 cells at the corresponding time points. (C) Protein levels of CASP3, Cleaved CASP3, and TUBA4A in H9c2 cells treated with 20 µM chloroquine (CQ) for 16 h. n = 6–8 per group. Data are mean ± SEM. Unpaired t tests were used to determine statistical significance between two groups. *P < 0.05. (D) Cell death in H9c2 cells cultured in nutrient-replete medium. H9c2 cells were treated with 20 µM CQ. There was no evidence of cell death at 16 h. However, cell viability is reduced at 24 h. Images of H9c2 cells in the same location in each well were captured at time points indicated, followed by cell counting. n = 3 images at each time point per group. Data are mean ± SEM. Unpaired t tests were used to determine statistical significance between two groups at corresponding time points. *P < 0.05 vs. Veh-treated H9c2 cells at the corresponding time points. Source data are available online for this figure.

