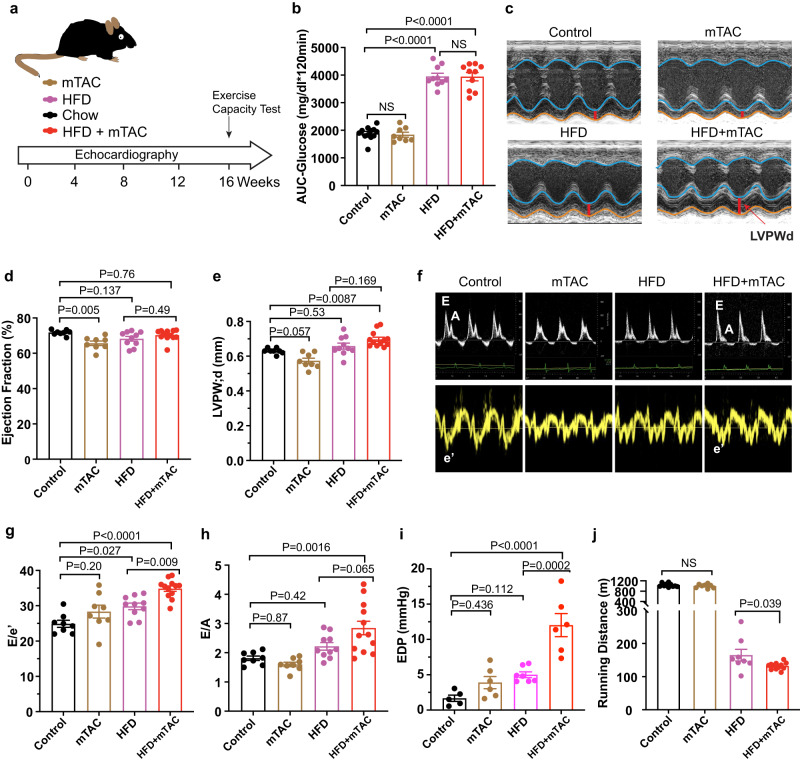
Fig. 1. HFD + mTAC mice developed key phenotypes of clinical HFpEF.
a Schematic overview of study design. Wild-type male C57BL/6J mice were separated into the following regimens for 16 weeks: standard chow (control), HFD, mTAC, or HFD+mTAC for 16 weeks. Heart function was measured with echocardiography every 4 weeks. b Area under the curve (AUC) of an intraperitoneal glucose-tolerance test of mice 16 weeks after induction (control n = 12, mTAC n = 8, HFD n = 10, HFD+mTAC n = 10 mice). c Representative LV M-mode echocardiographic tracings. Images are representative of 8–10 independent mice. d, e Echocardiographic measurement of ejection fraction and LVPWd 16 weeks after induction (control n = 8, mTAC n = 8, HFD n = 10, HFD+mTAC n = 12 mice). f Representative pulsed-wave Doppler (top) and tissue Doppler (bottom) tracings after 16 weeks of induction. Images are representative of 8–10 independent mice. g, h Non-invasive Doppler analysis of E/e’ and E/A ratios 16 weeks after induction (control n = 8, mTAC n = 8, HFD n = 10, HFD+mTAC n = 12 mice). i Pressure-volume loop measurement of EDP in each group of mice at 16 weeks after induction (control n = 5, mTAC n = 6, HFD n = 7, HFD+mTAC n = 6 mice). j Running distance during exercise exhaustion test (control n = 10, mTAC n = 8, HFD n = 8, HFD+mTAC n = 12 mice). Data are expressed as the mean ± SEM. Statistical analysis was performed using one-way ANOVA followed by Tukey’s multiple comparisons test (b, d, e, g–i). Statistical significance was assessed by unpaired two-sided Student’s t test between the two groups of HFD and HFD+mTAC (j). The exact P values are shown in the figures. NS, not significant. Source data are provided as a Source Data file.

