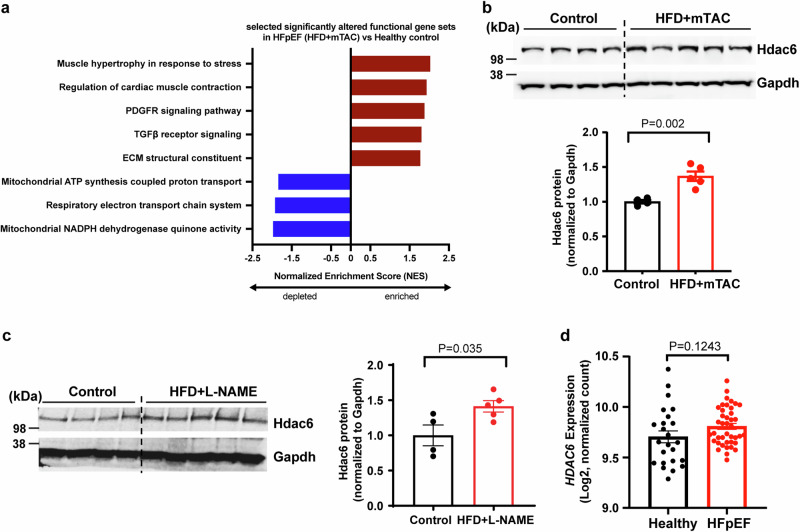
Fig. 2. HDAC6 upregulation in heart tissues from HFpEF mouse models and patients with HFpEF.
a Gene Ontology terms associated with upregulated and downregulated genes in HFD+mTAC mice (n = 5) versus control mice (n = 3). b Western blot analysis and quantitation of Hdac6 protein in heart tissues from control (n = 4) and HFD+mTAC mice (n = 5). c Western blot analysis and quantitation of Hdac6 protein in heart tissues of control (n = 4) and HFD + L-NAME mice (n = 5). d Quantitation of HDAC6 mRNA expression in human heart tissues of healthy (n = 24) and patients with HFpEF (n = 41) from published RNA-Seq data. Data are expressed as the mean ± SEM. Statistical significance was assessed by unpaired two-sided Student’s t test (b, c), or unpaired two-sided t test with Welch’s correction (d). The exact P values are shown in the figure. ECM, extracellular matrix. Source data are provided as a Source Data file.

