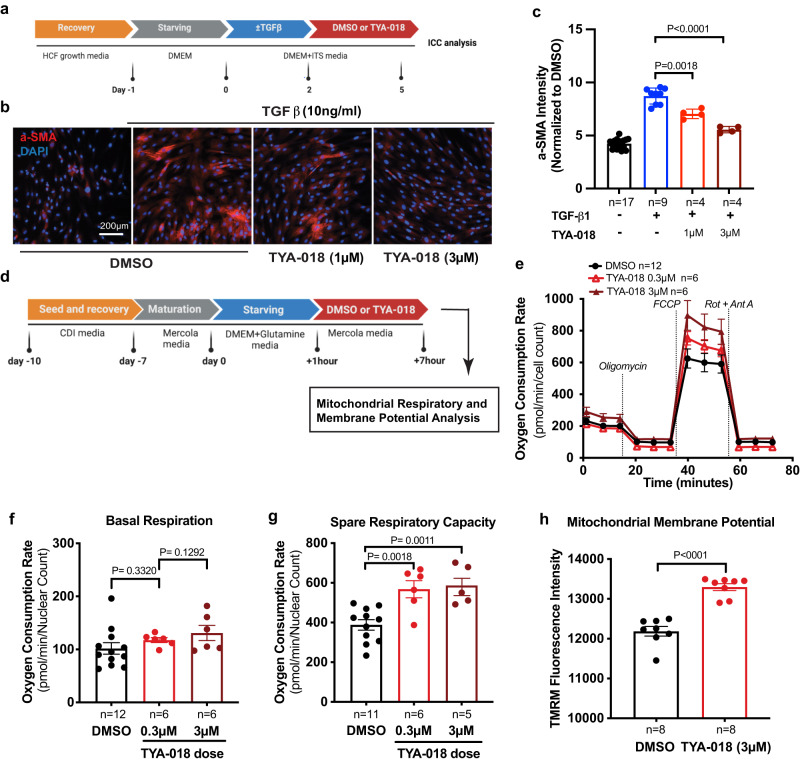
Fig. 7. TYA-018 reduces cardiac fibroblast activation and improves the metabolic signature of iPSC-CMs.
a Schematic diagram of an in vitro model of cardiac fibroblast activation using TGF-β. b Representative immunocytochemistry (ICC) images of α-SMA (red) and 4′,6-diamidino-2-phenylindole (DAPI; blue) staining in cardiac fibroblasts. Scale bar, 200 μm. c Quantification of cardiac fibroblasts positive for α-SMA after treatment with TYA-018 (1 and 3 µM). d Schematic workflow of Seahorse oximetry analysis in human iPSC-CMs. Seahorse oximetry kinetics (e), and quantification of basal respiration (f), reserve respiratory capacity (measured by the oxygen consumption rate) (g) in iPSC-CMs after treatment with TYA-018 0.3 µM and TYA-018 3 µM versus DMSO control. h Quantification of average florescent TMRM signal (normalized to DMSO) in iPSC-CMs treated with TYA-018 (3 µM) versus DMSO control. Data are expressed as the mean ± SEM. Statistical analysis was performed using two-tailed unpaired Student t test (c, f–h). The exact P values and replicates are shown in the figures. Source data are provided as a Source Data file.

