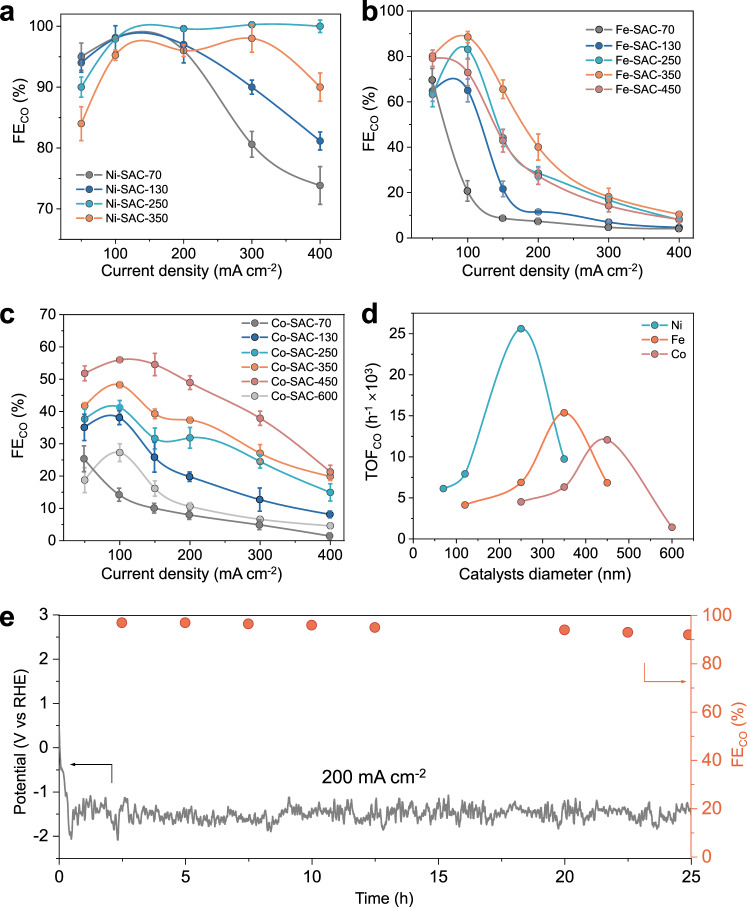
Fig. 4. CO2R performance of the SACs.
FE for CO production over (a) Ni-SACs, (b) Fe-SACs and (c) Co-SACs with different diameters as a function of applied current density measured in acidic electrolyte (0.1 M K2SO4 + H2SO4). All the error bars represent standard deviation based on three independent samples. d TOFs for CO production at −1.5 V vs RHE over Ni-SACs, Fe-SACs, and Co-SACs as function of SAC sphere diameter. e Stability test of Ni-SAC-250 catalyst at 200 mA cm−2 measured in acidic electrolyte. Source data are provided as a Source Data file.

