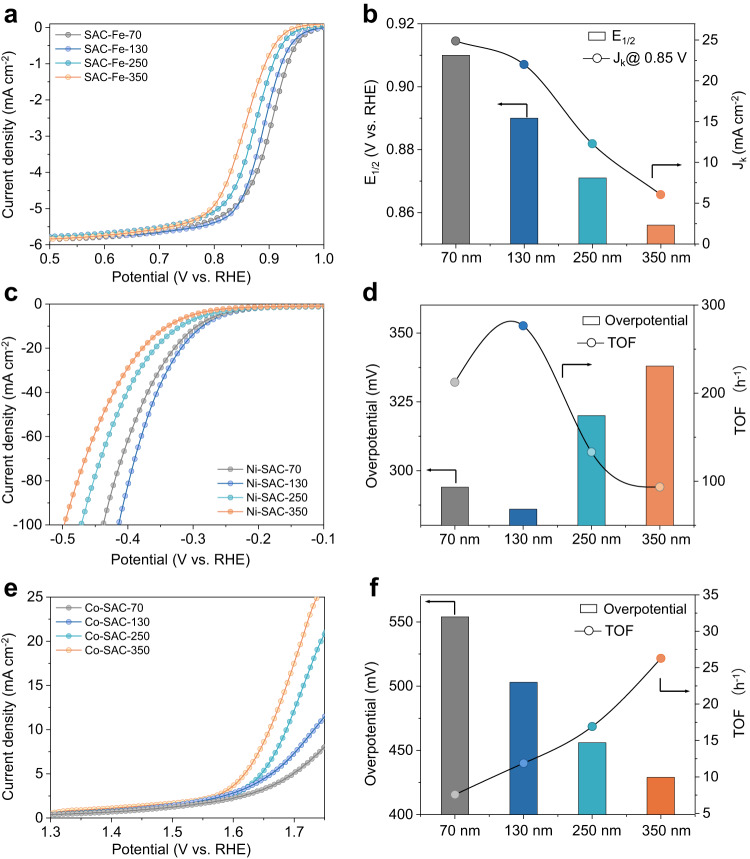
Fig. 5. ORR, HER and OER performance of the SACs.
a LSV curves of Fe-SACs with different sphere diameter in O2-saturated 0.1 M KOH at 1600 rpm for evaluating ORR activity. b ORR Jk at 0.85 V (vs. RHE) and E1/2 of different Fe-SACs. c LSV curves of Ni-SACs with different diameter in 1 M KOH for evaluating HER activity. d HER overpotential at 10 mA cm−2 and corresponding TOFs of different Ni-SACs. e LSV curves of Co-SACs with different diameter in 1 M KOH for evaluating OER activity. f OER overpotential at 10 mA cm−2 and corresponding TOFs of different Co-SACs. Source data are provided as a Source Data file.

